Consider the urban transit “problem.” In the 1960s the problem was declining transit patronage. Finances received little discussion because the industry was essentially self-supporting: operating costs were so low that passenger revenues covered costs. In the 1990s “problem” has a whole new meaning: financial deficits. Today, most transit revenue comes from governments, not passengers, and the result is continual fiscal crisis-the search for money to continue the subsidies.
The new transit problem grew from our efforts to solve the old one. Starting in the mid-1960s, federal policy encouraged public takeover of the privately owned, self-supporting transit industry. Public ownership was able to halt the long-term decline in ridership, but it also led to an increasingly severe financial deficit. Underlying the deficit is the large decline in the industry’s productivity- output per dollar of input. Indeed, if transit productivity had merely remained constant since 1964, when federal intervention began, total operating costs would be more than 40 percent lower-enough cost-reduction to erase most of the current operating deficit, without raising fares.
It’s uncommon to find such a rapid productivity decline in any industry. In general, productivity increases over time, and a given quantity of input produces more and more output-which is why per capita income rises. Thus the productivity change in the transit industry is notable for both its downward direction and its magnitude. Nor is there anything inherent in the transit industry that creates decline. Among privately owned bus companies, productivity rose 8.3 percent over this period.
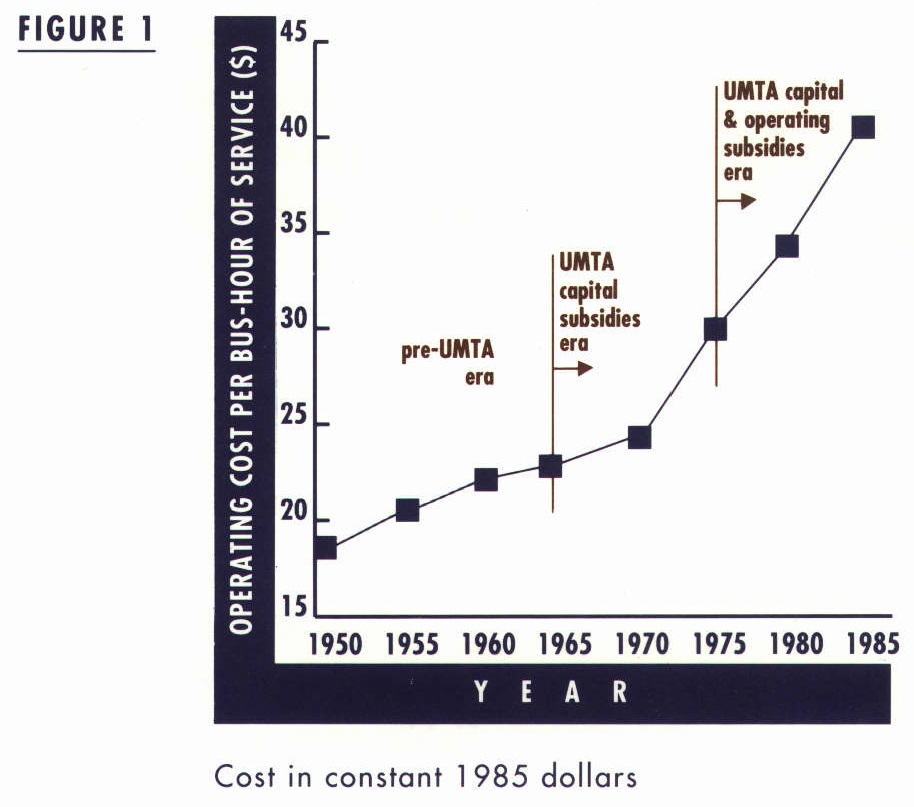
To put all this into more concrete terms, Figure 1 shows what has happened to operating costs over time. The vertical axis shows what it cost the average transit agency to put a bus out onto the street for one hour, in constant 1985 dollars. Costs were creeping up slowly before the federal-subsidy era. When the Urban Mass Transit Administration (UMTA) began giving capital subsidies, the creep picked up speed, and when UMTA began giving operating subsidies, costs began to soar.
The Study
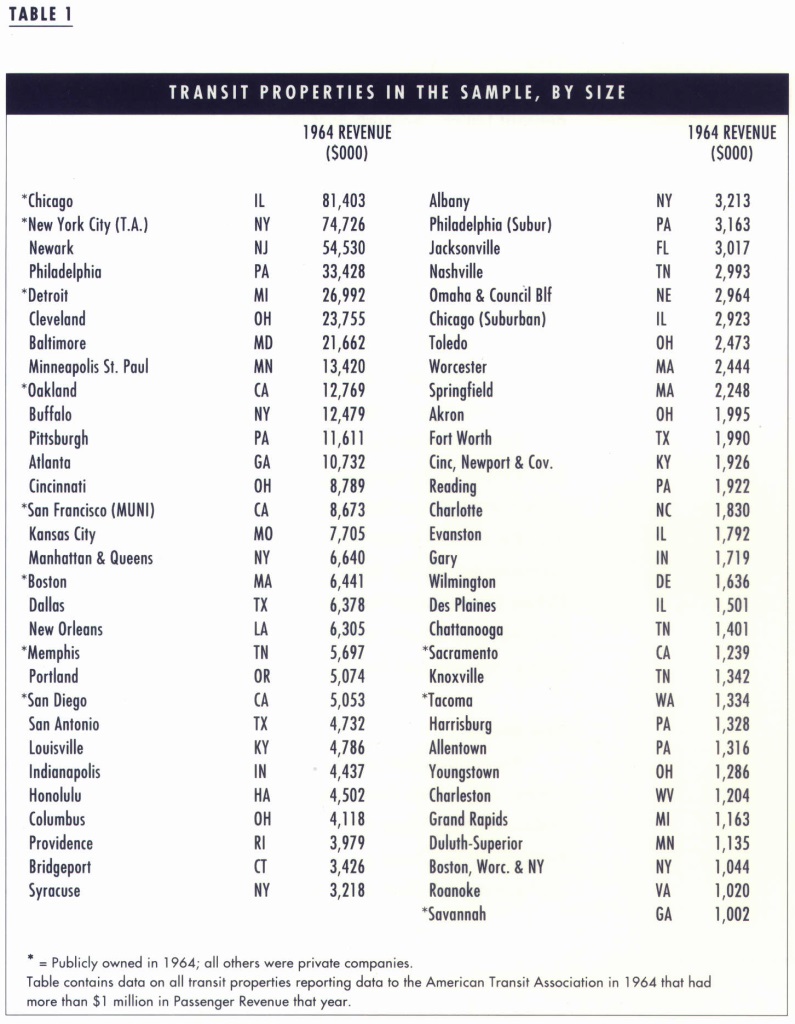
We compiled detailed records for the 61 largest transit properties- those with operating revenues greater than $1 million in 1964-tracing their individual financial histories from 1950 through 1985. These are shown in Table 1. To avoid the distorted “averages” that aggregate statistics often produce, we worked with individual transit properties. We combined data from a given year, giving equal weight to all properties. Thus our averages reflect the characteristics of a typical property.
Consider first the financial situation of a typical transit property thirty years ago. In 1964, 82 percent of the properties were still privately owned. The top row in Table 2 shows one of the key financial indicators, revenue divided by operating costs. Revenue was greater than operating costs during the period 1950-1964. In 1964 the revenue/cost ratio was 1.05 at a typical property. The only really low ratio was 0. 70 for San Francisco Muni-which, significantly, has been publicly owned and operated since 1912.
Since the transit industry was covering its operating costs, why did the government deem it necessary to get into the transit subsidy business? One reason had to do with projections of long-run viability. Although the transit properties were taking in more money then they were paying out (row 1), that did not assure long-run viability because these figures do not include depreciation costs.
In row 2 we add depreciation to operating cost. This statistic answers the question: can the property cover its immediate cash flow and have enough money left over to replace equipment when it wears out? The answer for a typical property in 1964 was, no. The typical property was gradually running down its capital stock. This was the background for one intervention theory: passengers were fleeing the worn out, ill-maintained, outdated rolling stock. If only the properties could somehow obtain modern equipment and restore service, passengers would return to public transit.
Thus UMTA’s program began as a kind of one-shot injection of new capital. Give the transit properties new equipment and all would be well. AS we know, it didn’t turn out that way.
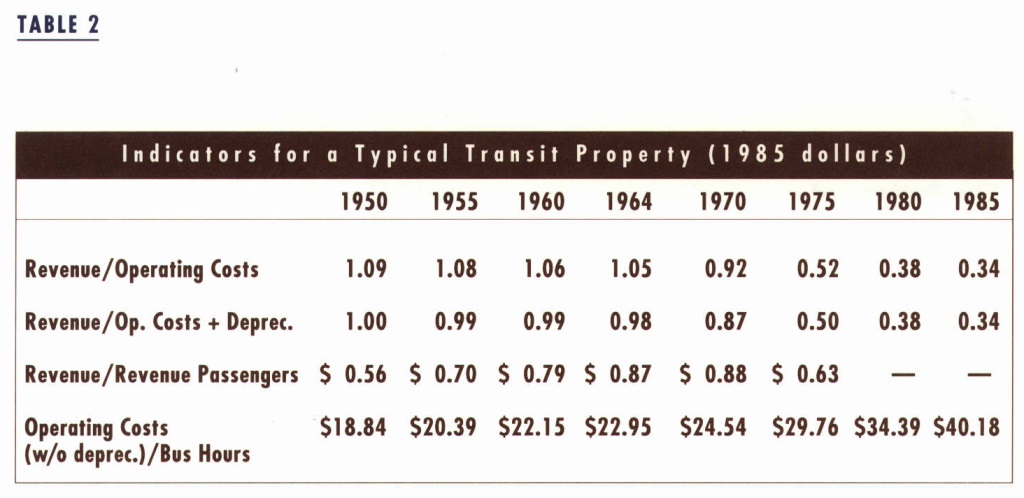
The initial UMTA subsidy program, in 1964, was confined to capital subsidies; transit companies still had to earn their own operating costs. But 1975 saw a radical change in the UMTA program: the federal government began subsidizing operating costs as well. The third row, revenue per revenue-passenger, hints at the consequence of this decision. Passenger fares had been rising steadily up through 1972 as transit managers struggled to cover their rising costs. After 1975 all attempts at fare-discipline were put aside, and passenger revenue fell.
The drop in revenue may be viewed in two quite different ways. First, one may see it as the result of removing the remaining constraint on transit management: the obligation to earn operating costs. Second, one may see it as a major change in the goals assigned to transit managers.
The old goal was straightforward: provide a self-supporting service for those who wished to use it. The new goal, assigned by the government, was complex and nebulous: use transit service as a tool to solve urban problems, save the central city, provide cheap mobility for the poor, transport the handicapped, and so on.
Implementing the new goal required expansion of transit service into low density areas that could not generate much patronage, and reduction of fares to make them affordable to anyone. The fall in revenue was a direct consequence.
The Productivity Plummet
But transit’s financial crises is not just a revenue problem. More is involved than the decline in earnings. The other half of the problem is an enormous increase in the cost of supplying the service (reflected in the falling productivity) . The fourth row in Table 2 shows that operating cost per bus-hour rose from $22.95 in 1964 to $40.18 in 1985. (All costs are in constant 1985 dollars.) That is, the real cost of putting an hour of bus service onto the street has nearly doubled since the federal government became involved in the transit industry.
A Digression on Productivity Measurement
Productivity is output divided by input. What is the “output” of a transit system? It would be unfair to use bus-miles as the output-measure: increases in traffic congestion lower a property’s output of bus-miles, hence lowering its apparent productivity. But congestion is not a factor within their control, and the greater congestion in large cities would put their transit properties at a disadvantage on this measure. Likewise passenger- miles is not a fair measure of transit output: this is an era when transit managers have been told to run buses into low density suburbs to lure people out of cars, and to provide mobility in areas which are inherently unsuited to achieving reasonable bus load factors. We should not judge the productivity of a transit system by using measures that its managerial decisions cannot affect. Bus-hours of service is a fairer indicator.
To measure the input side of productivity, we use total operating costs. This is, in effect, a weighted average of the cost of everything that goes into producing transit service.
The Pattern of Productivity Changes
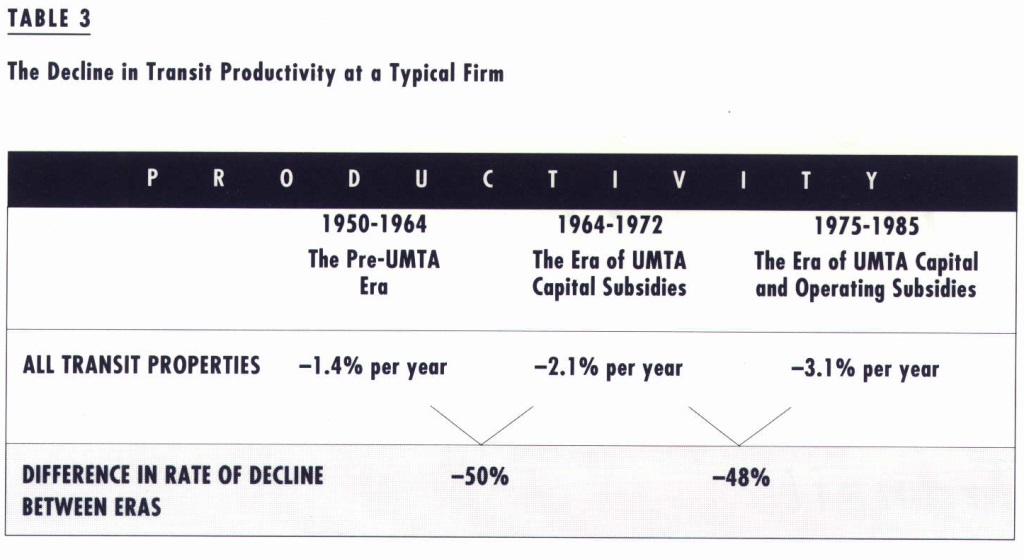
It is not enough to know that productivity plummeted after the government began helping the industry. We need to ask what would have happened to productivity in the absence of government help. Such contrafactual questions are inherently difficult. We need an alternative baseline to compare to the actual productivity change. So we project the 1950-1964 productivity trend into the future and then compare this to the observed outcome. This is shown in Table 3. The total time period is divided into three parts: the pre-UMTA era, the era of capital-subsidy only, and the era of capital-plus-operating subsidies. In the pre-UMTA era, productivity declined at the rate of 1.4 percent per year; in the era of capital subsidies, productivity declined at 2.1 percent per year; and in the era of operating cost subsidies, productivity declined at 3.1 percent a year. That is, the decline in productivity accelerated by 50 percent when capital subsidies began, and accelerated by another 48 percent when operating subsidies were added in as well. Government intervention strongly altered productivity trends.
All transit properties were not equally affected. Productivity trends differed by the size of the transit property: it fell by 121 percent at the large properties, by 75 percent at the medium properties, and by 62 percent at the small properties.
That is, size is correlated with rate of decline. Why might this be so? The large transit properties are mostly in older cities, those built before the auto age. These cities have poor street systems, little parking, and more people who depend on transit as their primary source of mobility. A transit strike in such cities is genuinely paralyzing. Transit strikes have much less effect in the smaller cities because residents there have many alternative forms of mobility. Thus, it seems likely there will be far more pressure to settle strikes at higher wage terms in large cities, and that transit management in these cities will be less able to resist productivity declines (labor is about three-fourths of total operating costs).
It Wasn’t Supposed To Turn Out Like This
Federal policy started out with the notion of a one-shot injection of capital to rejuvenate the aging physical plant of our transit systems. A cure, not perpetual hospitalization. It didn’t work out that way. The subsidy money encouraged government meddling in transit operation, asking transit systems to undertake a variety of activities unrelated to their traditional goals.
The subsidies sent the wrong signals to management and labor. Management interpreted the message to mean: efficiency was no longer primary; rather, it was more important to expand passenger demand and to provide social services. So routes were extended into inherently unprofitable areas and fares were lowered to the point where no one would find them burdensome. Labor interpreted the message to mean: management now has a Sugar Daddy who can pay for improvements in wages and working conditions.
Thus, over time, the federal doctor developed new therapeutic goals, and the transit patient developed an addiction to the treatment. Our attempts to solve the original problem created a new one: a serious decline in the basic productivity of the industry, with an inevitable growth in financial problems as the result.
Further Reading
A. Altshuler. J.P. Womack. and J.R. Pucher. The Urban Transportation System: Pol/tics
and Policy Innovation. (Cambridge. MA: The MIT Press, 1979).
Wendell Cox, “Achieving the Policy Goals of
Public Transit Through Competitive Contracting,” Paper presented at the UMTA Transit Policy Workshop, Annapolis, MD, September 1988.
Charles Lave, ” Federal Subsidies and the Ruinous Decline in Transit Productivity: It Wasn’t Supposed to Turn Out Like This,” Transportation Planning and Technology, Vol. 15, 1991, pp. 115-124. UCTC No. 74. J .R. Meyer and J .A. Gomez-Ibanez,
“Measurement and Analysis of Productivity in Transportation Industries” in J .W . Kendrick and B.N. Vaccara, New Developments in Productivity Measurement and Analysis, (Chicago: University of Chicago Press, 1980).
Don Pickrell, “Rising Deficits and the Uses of Transport Subsidies in the United States,” Journal of Transport Economics and Policy, Vol. 24, No. 3 , 198S, pp. 281 -298.
J . Pucher, A . Markstedt, and I Hirschman, “Impacts of Subsidies on the Costs of Urban Public Transport,” Journal of Transport Economics and Policy , Vol. 17, No. 2 , 1983, pp. 156•1 76.
Martin Wachs, ” U.S. Transit Subsidy Policy: In Need of Reform,” Science, Vol 244, June 30, 1989, pp. 1545-49.