Over the past thirty years the federal government has funded extensive programs to improve travel options for people who do not have their own vehicles. During this same period, independent of government actions, economic and demographic trends have diminished the target population and made vehicle access nearly universal, even among the poorest households. In 1969, 20.6 percent of households (HHs) had no vehicle. By 1983 this ratio had fallen to 13.5 percent. By 1990, it fell to 9.2 percent of HHs. Further, HHs without vehicles tend to be smaller than average, so in 1990 the zero-vehicle HHs comprised only 6.4 percent of the population.
Who Are They?
The typical zero-vehicle HH (0-VHH) has no one in the labor force (neither employed nor searching for work), has a lower than average income, and is located in the central part of a large urban area. In life cycle terms, most of these HHs are either retired older people or single adults without children. Most zero-VHHs are headed by women.1
Although zero-VHHs have lower incomes than HHs in the general population, only 27 percent of them are below the poverty level. Poverty alone is not sufficient to explain why HHs have no vehicles. Of all adults living in HHs below the poverty level, 76.1 percent are in HHs that have at least one vehicle.
Where Are They?
Most zero-VHHs are in central cities of Metropolitan Statistical Areas (MSAs). Of adults living in zero-VHHs, 52.9 percent are in central cities, with the remainder about evenly split between suburbs and nonMSA locations. Zero-VHHs outside the central city are less mobile: 52 percent of adults living outside the central city took no trips at all on the sample day; inside the central city only 37 percent stayed home all day.
To the extent that federal policy seeks to assure mobility for all, it needs to concentrate more attention outside the central cities.
How Do They Travel?
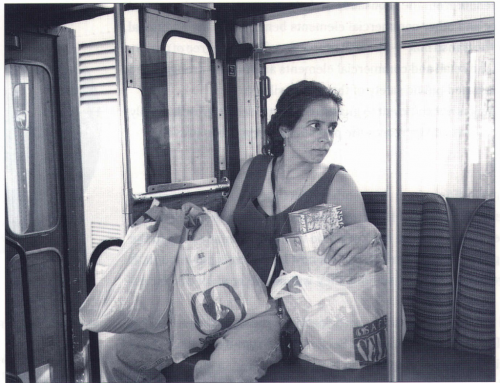
Commuting is not an overwhelming concern since only 31.3 percent of zero-VHHs have a family member in the labor force. Adults living in zero-VHHs make 43 percent of their daily trips by walking. Because most zero-VHHs are in central urban locations, their transit access is good: 53 percent report they have transit access within three blocks; 65 percent have transit access within twelve blocks. Yet adults living in zero-VHHs use transit for only 16 percent of their trips.
Surprisingly, adults living in HHs without vehicles make twice as many trips by private vehicle as they do on transit (36 percent versus 16 percent). The share of travel on public transportation is essentially constant across education levels, but the private-vehicle share declines as education increases, and the walk-mode share increases with education. Regarding trip purpose, the reason for travel tends to be about equally divided between errands, social activities, and shopping.
Mobility: How Much Do They Travel
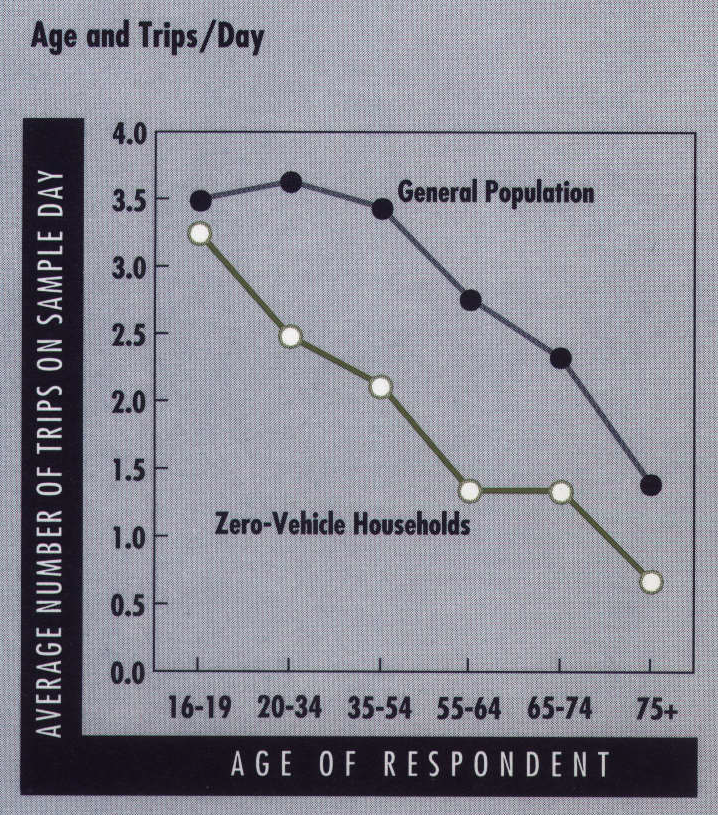
From a social viewpoint, we are interested in seeing how well the people in zero-VHHs get around -whether they have enough mobility options to lead reasonable lives. One possible measure of mobility is the average number of trips per day made by persons in zero-VHHs. (A trip is a one-way journey; the roundtrip commute to work would be two trips.) The average adult living in a zero-VHH made 1.8 trips per day. The corresponding figure for the general population is 3.2 trips per day. This is a substantial difference, but it primarily reflects the different proportions of workers and the elderly in each group.
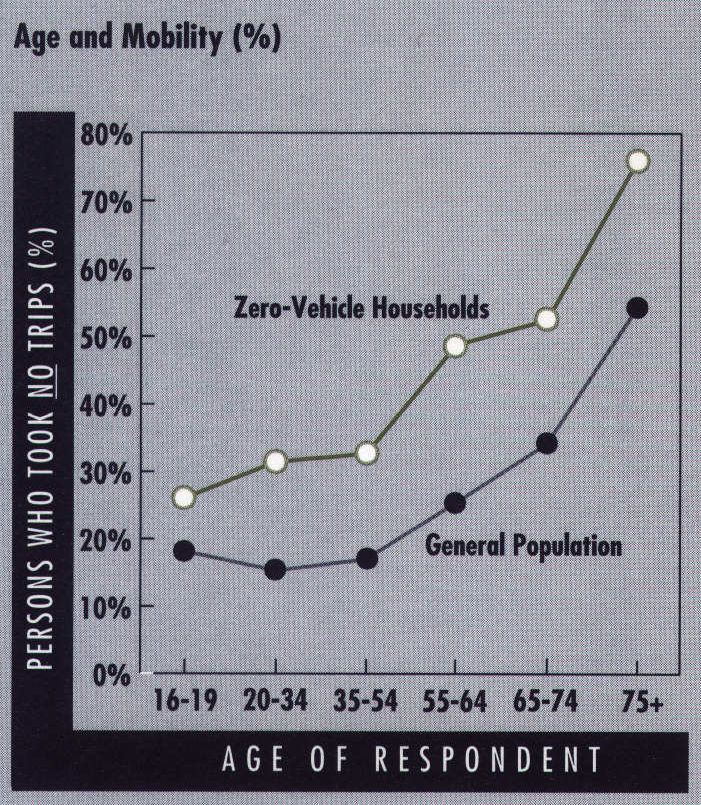
Another possible measure of mobility is the total absence of trip-taking on the sample day – the proportion of people who took no trips at all. Of all adults living in zeroVHHs, 46 percent made no trips during the sample day. The corresponding figure for the general population is 21 percent Again, a substantial difference in mobility, and again, much of it reflects the different proportions of workers and the elderly in the two groups.
We can measure both “trips per day” and “percent who took no trips.” Which is the better gauge? The zero-trip measure is a more sensitive measure of immobility. Trips per day, being an average, is more influenced by outliers – a few respondents with a large number of trips can affect the average, though the proportion of immobile people might still be the same. One might think of average trips per day as a measure of mobility, and the zero-trip proportion as a measure of immobility.
Demographic Effects On Travel
Demographic differences within the zero-VHH population produce strong effects on mobility patterns:
- Workers travel much more than nonworkers: 2.85 trips/ day versus 1.35 trips/ day;
- The young (20-34) travel much more than the old (65-7 4): 2.48 trips/ day versus 1.34 trips/ day;
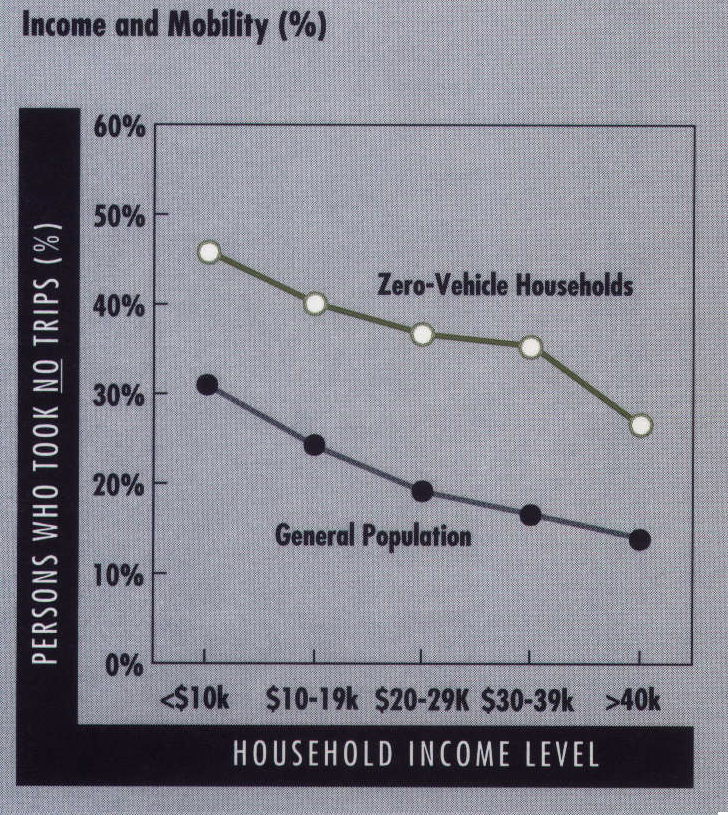
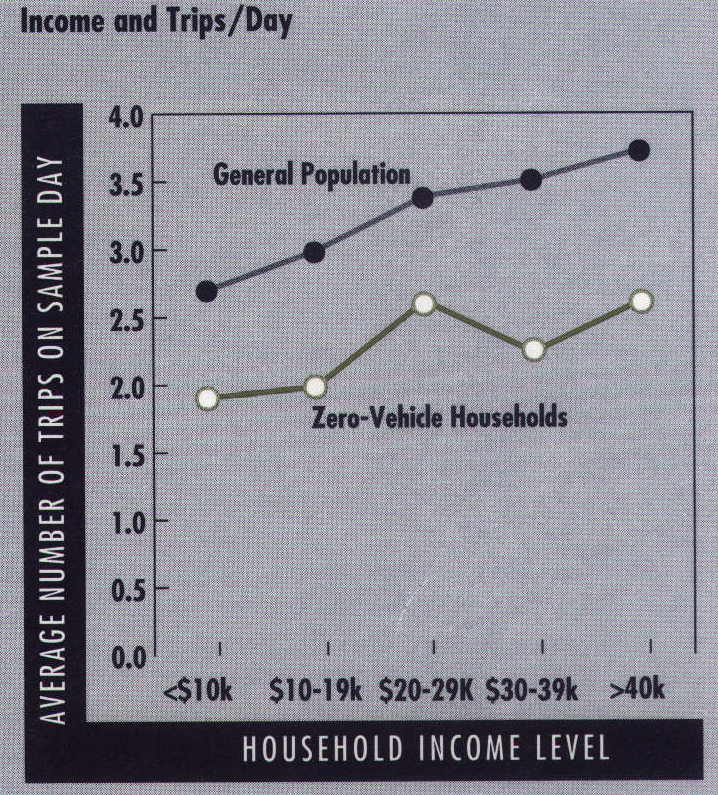
- Higher incomes produce more travel: 2.62 trips/day at $40,000 plus income versus 1.91 trips/day for the under $10,000 income group;
- Men travel more than women: 2.1 trips/day for men versus 1.69 trips/day for women;
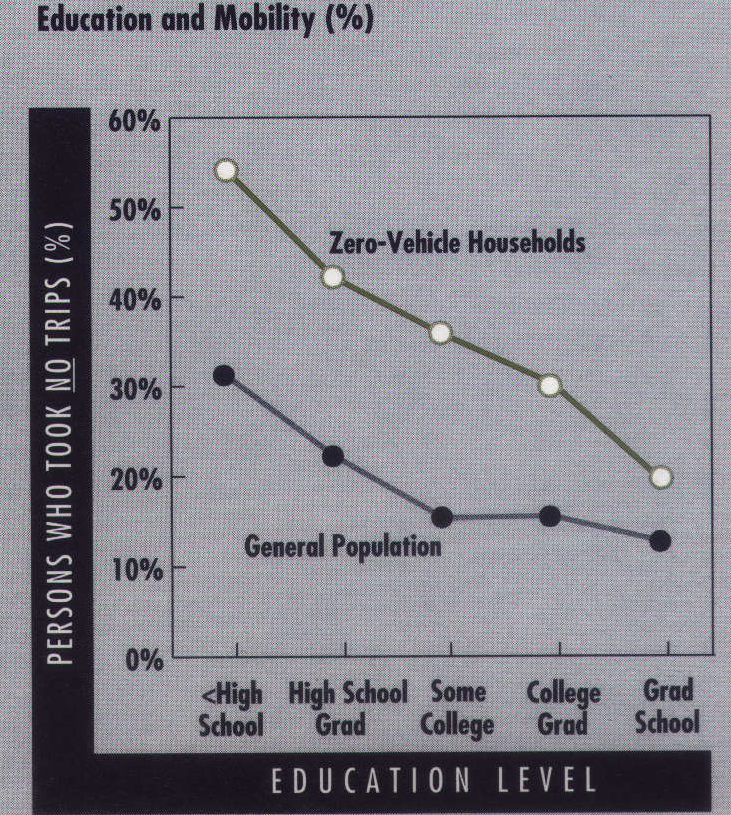
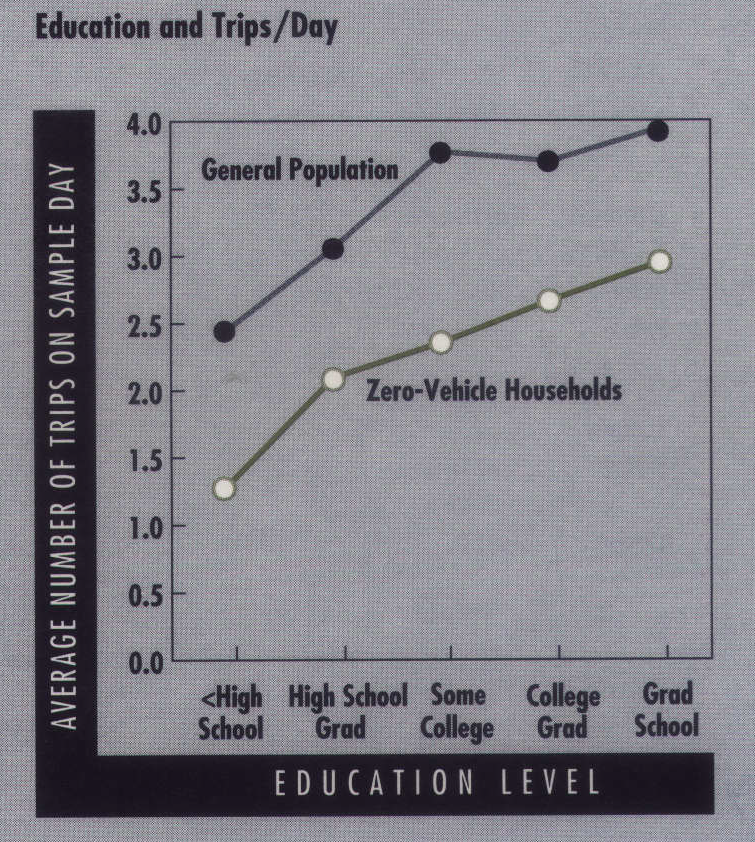
- Education produces remarkably strong effects: 2.67 trips/ day for college graduates versus 1.28 trips/ day for those without high school degrees and only some of this change can be accounted for by income differences.
Travel Behavior Of Older Persons
Persons sixty-five and older account for almost half of all zero-VHHs. Our major finding is that their travel is not affected by changes in most of the explanatory variables. For example, there is little difference in trips per day by gender, ethnicity, or across the observed ranges of income and education.
The geographic consistency is also quite striking. There is almost no difference in either trips per day or proportion of persons with zero-trips across the three MSA categories, the size of the urban area, or the population density.
Consider the implications of these findings. Transit access is certainly much better in the central city of an MSA than it is in a nonMSA, yet there was no difference in mobility patterns. Transit access is certainly much better in large urban areas than in small ones, but again there was no difference in mobility patterns. Transit access is certainly much better in high-density areas than in low-density ones, but we find only small increases in mobility in the densest areas. Taken together, these three findings seem to indicate that the presence or absence of transit makes little difference in the mobility patterns of older people.
Immigration and Vehicle Ownership
New immigrants have much lower vehicle ownership rates than the native-born population, but vehicle ownership increases strongly with length of stay in the US. The fastest rate of change is for Asian immigrants, the slowest is for black immigrants. The change is inherently interesting because these immigrants come from cultures less auto-obsessed than our own. What explains the change in their vehicle ownership patterns over time? The data indicate that increased income, rather than any change in values toward the automobile, is the overwhelming factor behind the decline in zero-VHHs among immigrant groups.
Acknowledgements
This research was funded by a contract from the Federal Highway Administration of the US Department of Transportation. We owe special thanks to Susan Liss and Elaine Murakami for their support and advice.
Further Readings
US Department of Transportation, “Travel by Households Without Vehicles,” Travel Mode Special Reports: 1990 NPTS Report Series, Chapter 1 (Washington, DC: December 1994).