Transportation planners have traditionally considered land use policy to be outside their purview and have generally accepted existing (or proposed) land use policies and patterns as a given. That attitude changed, however, with the passage of the Intermodal Surface Transportation Efficiency Act of 1991 and the Clean Air Act Amendments of 1990. For the first time, the law required planners to explicitly consider the effects of alternative land use policies on local land use patterns and thus on transportation system performance.
In responding to these new requirements, transportation planners quickly discovered their existing forecasting models deficient in two respects. First, the existing models could not be reliably used to test the land use and transportation implications of alternative regional and local land use or development policies. Nor could the models be used to analyze how major transportation investments such as freeways or mass transit systems might shape future land use patterns. What was needed-and is still needed-was a new conceptual approach for connecting local land use policies and patterns with transportation system performance.
The California Urban Futures Model (CUFM) offers one such approach. It is an urban growth simulator that “grows” counties and their constituent cities by determining how much new residential development is likely to occur at specific locations. It mimics the economics of real estate markets, with outcomes determined by profitability, site characteristics, population growth trends, and a series of scenarios consisting of alternative development restrictions and/or incentives. CUFM is distinguished by its explicit focus on the effects of alternative land use policies.
Using the Model for Transportation Planning
Local, county, and regional transportation planners can use CUFM in two ways.
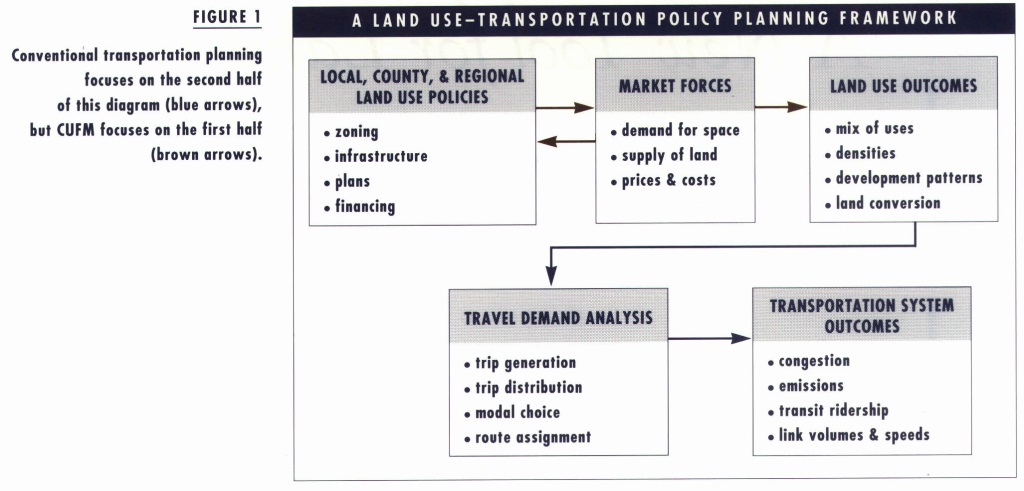
- They can use the model to check effects of land use on travel by aggregating the model’s outputs-the locations and densities of new development- into traffic analysis zones for conventional transportation planning. Thus, they can examine how different land use policies might affect transportation-system outcomes (traffic volumes, congestion levels, pollutant emissions, transit ridership). It may be, for example, that policies promoting more compact urban development lead to greater transit ridership in some corridors and to greater highway congestion in others. Alternately, to the extent that certain environmental protection policies might work against higher density development, they might ultimately lead to greater auto usage.
- Transportation planners can use the model to test the effects of specific transit investments on development patterns and densities. To the extent that transportation investments are worthwhile – that is, create value –neighboring property values should rise, leading ultimately to more intense development and higher densities. (CUFM assumes more profitable sites develop earlier and at higher densities than less profitable sites.) No empirically tested model currently exists to test the relationship between transportation investments and land use forms. Instead, policy discussions are often dominated by unsupported claims· regarding the ability of specific transit or highway investments to radically reshape urban development patterns. CUFM provides an empirically founded framework for testing such hypotheses.
Recent studies of rail mass transit systems in California, for example, have produced differing estimates of this capitalization effect. Home sales prices in Alameda and Contra Costa Counties in 1993 increased between $1.96 and $2.30 per meter of travel to a BART station. Homes near San Diego trolley stations also sold at a premium. Researchers found no such premiums for proximity to freeway interchanges or to other mass transit systems. These types of transportation premiums-when and where they occur-can easily be included in the model’s calculations.
The Logic of CUFM
CUFM consists of four linked submodels, run recursively (Figure 2):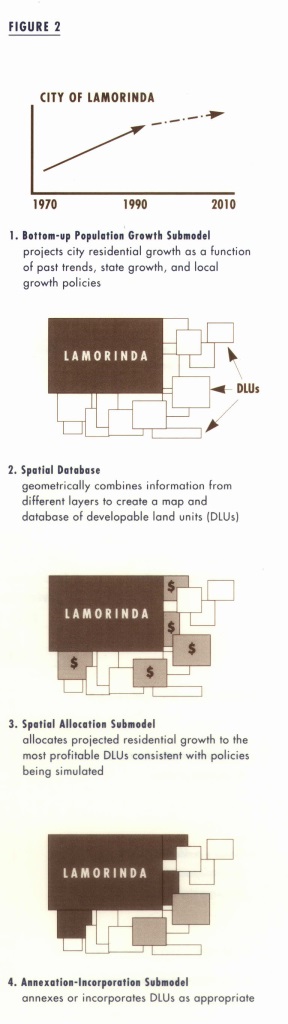
- The Bottom-up Population Growth Submodel is the demand side of the model. It consists of two regression equations, one for cities, one for counties. This submodel generates five-year population growth forecasts for every city and county in the model study area. Unlike most urban forecasting models, which project local population growth solely by distributing regional or county growth totals, this model projects each city’s population growth as a function of its current size, its growth history, its outward expansion potential, and adoption of specific policies intended to promote or retard growth.
- The Spatial Database is the supply side of the model. It consists of a series of map layers that describe the environmental, land use, zoning, current density, and accessibility characteristics of all sites in the region or county. These various layers can be analyzed individually or merged into a single layer describing development or redevelopment. An example of a developable land unit (DLlJ) would be an undeveloped site with steep slopes, served by sewers, zoned for light industrial uses, located less than 500 meters from a major freeway. DLUs are not legal parcels; however, they may approximate collections of parcels in urbanized areas. The spatial database is also the primary tool for displaying the model’s outcomes in map form.
- The Spatial Allocation Submodel is a series of procedures for allocating projected population growth to appropriate sites or DLUs. The primary function of this submodel is to “clear the market”: to match demand (as manifest through city and county population growth) to the supply of developable sites (as described by the attributes, size, and location of DLUs). The sub model evaluates, eliminates, and sorts the sites according to profitability and suitability and then assigns projected population growth accordingly. The allocation process is complete either when all forecast population growth is allocated, or when all available DLUs are filled. Depending on the land use policy scenario chosen, the model can collect any unallocated population growth as potential “spillover.”
These procedures assume land developers seek to maximize profit, while adhering to governmental land use and environmental regulation and conforming to prevailing or permitted development densities.
- The Annexation-Incorporation Submodel is a series of decision rules for annexing newly developed DLUs to existing cities, or for incorporating clusters of DLUs into new cities.
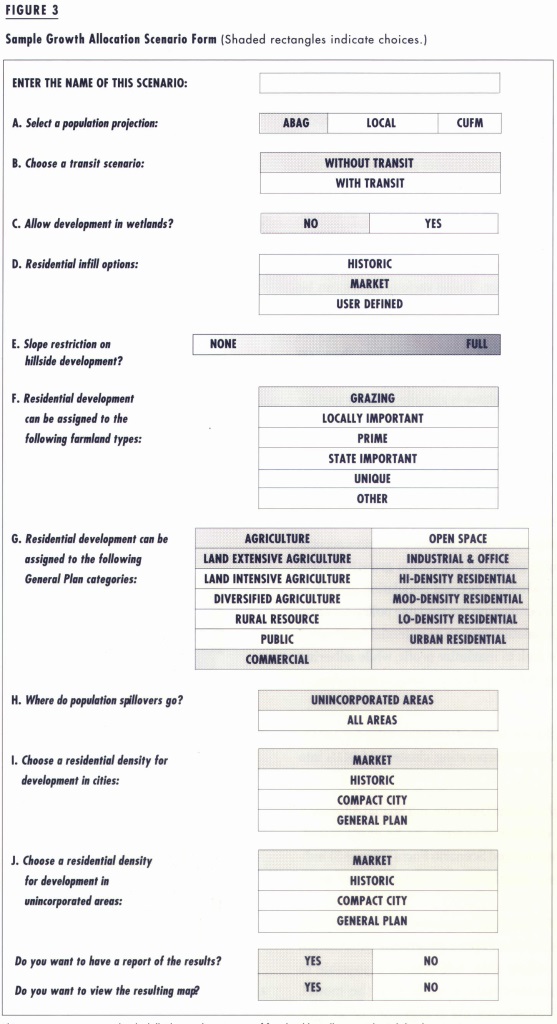
Once the data and parameters required for the Spatial Database and Spatial Allocation Submodel have been assembled, any number of policy scenarios can be easily tested. “Running” a scenario consists of filling out a computerized Scenario Form (Figure 3) indicating which specific development prohibitions, regulations, or incentives are to be applied in which areas.
CUFM differs from other operational urban forecasting/ simulation models. It details the supply side of urban land and housing markets, and it uses a geographic information system (GIS) to assemble and manage the supply side. GIS makes it possible to incorporate a wide variety of available map-based data directly into the model. Furthermore, the model allocates growth to individual sites, not to aggregate areas such as traffic analysis zones or census tracts.
CUFM assumes residential land developers serve as intermediaries between households (the ultimate consumers of land), and the various suppliers of inputs into the development process. Thus, the model incorporates localized differences in the cost and revenue structure of residential land development and then mimics the decision-making processes of private land developers. Work-trip travel times (or distances) – the key determinant of growth patterns in the majority of urban growth models – enter the model only indirectly, as determinants of intercity housing price differentials. The critical variables are development policies, not travel impedances.
The model also has a number of deficiencies. In its current form, it allocates residential growth but not commercial or industrial growth. Employment growth, specified at the county level, is treated as outside the model, and thus the model cannot be used to address issues of “jobs-housing balance.” And, because it does not deal explicitly with travel times or costs, CUFM is not a spatial interaction model.
An Example: County Growth Planning
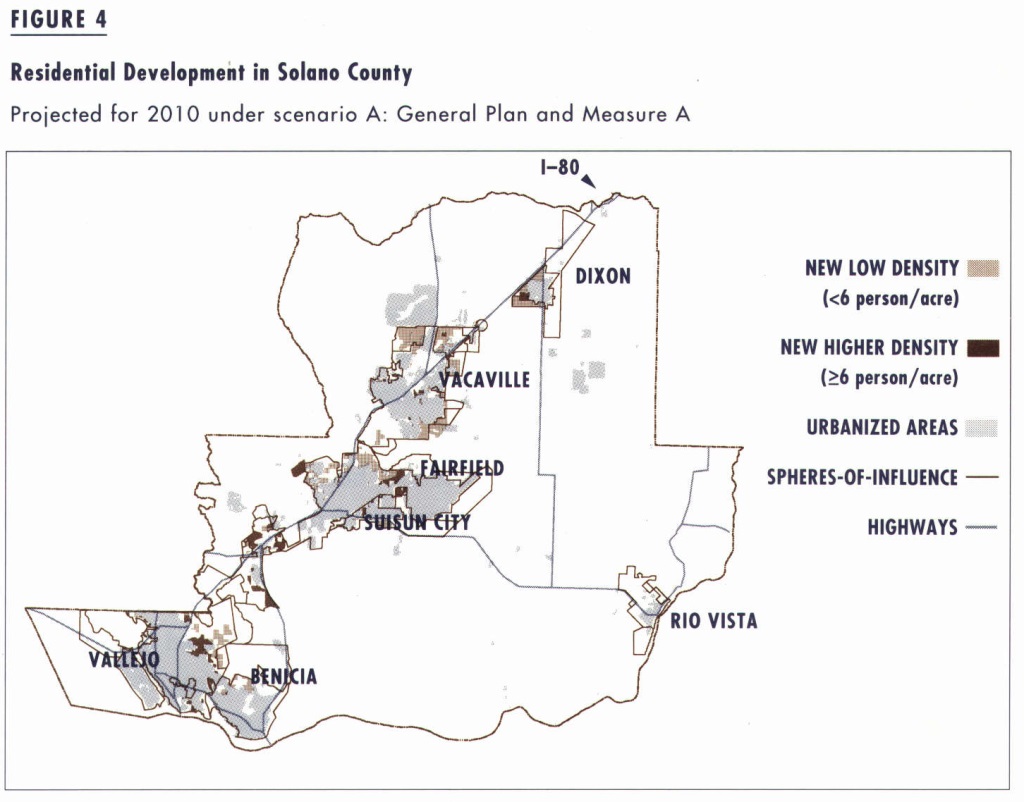
CUFM can be used at regional, county, or local levels. In a pilot study undertaken with the Association of Bay Area Governments (ABAG), we examined the development impacts of Measure A, a farmland-preservation ordinance adopted in Solano County, California.
Situated midway between San Francisco and Sacramento, Solano County is currently one of the Bay Area’s growth hotspots. According to ABAG, the population of Solano County is projected to grow by 201,000 persons by the year 2010. The majority of the county’s growth would be focused in three cities, Fairfield (+68,100), Vacaville (+44,600), and Vallejo (+29,800).
Solano residents and officials want job growth and economic development, but they are concerned about effects on the natural and historic environment.
Measure A, enacted in 1984, prohibits the intense urbanization of unincorporated county lands outside existing city spheres-of-influence. More significantly, it limits the density of new development on lands designated in the county general plan as reserved for agriculture. Because such lands cannot be intensively developed, Measure A made them less attractive to large-scale subdividers and homebuilders.
Although recently reenacted, Measure A was originally set to expire in 1995. How would future development patterns in Solano County have been different if the measure had not been renewed? We considered three scenarios:
- Measure A remains in effect through 2010. (This is the status quo.)
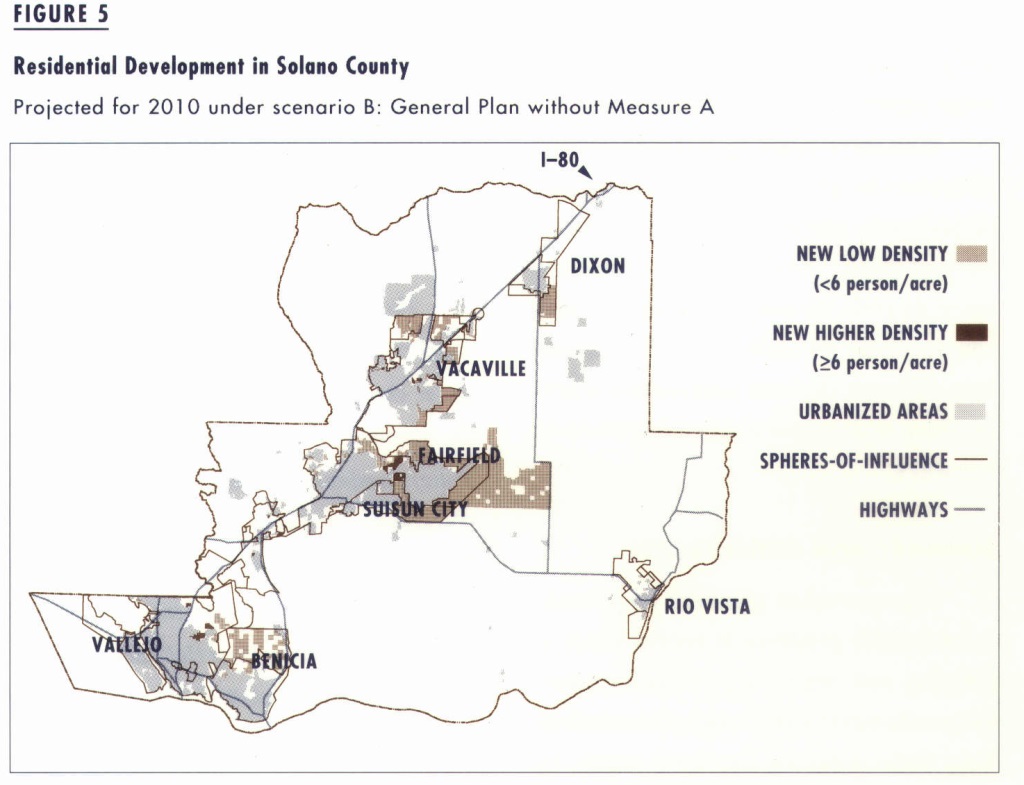
- Measure A expires in 1995, and current general plan land use designations remain in place. Many lands now in agricultural use would become open to more intense development. Development of each particular site would depend on its profitability in residential use.
- Measure A expires in 1995, but current general plan land use designations can be changed. Many agricultural parcels would become open to more intense development, and residential development could occur on commercially designated and agricultural sites. Again, profitability in residential use would determine the rate of development.
None of these policy scenarios would turn development away from Solano County because more than adequate developable land exists in all three cases. Under scenarios B and C each city would be able to accommodate its projected level of growth within its current sphere-of-influence. Growth would not be displaced from one community to another.
The same cannot be said for scenario A. With Measure A in effect, large amounts of farmland in the spheres-of-influence of Benicia and Suisun City would be precluded from urban development, and both cities would become large growth exporters. Benicia would export 12,000 residents to other parts of the county, while Suisun City would export 6,600 residents. Most of this displaced growth would spillover into Vallejo and Dixon.
A picture being worth a thousand words, one of the useful aspects of CUFM is its ability to present results in easily understood map form. Figures 4 and 5 graphically compare projected development patterns under scenarios A and B.
With these maps, local transportation planners can gain a much clearer picture of precisely where new facilities (highways or transit lines) might be needed to serve growth. Similarly, county planners can use these scenario results to evaluate how different land use alternatives might increase or decrease congestion levels on freeways.
Summary and Conclusions
Transportation planners have made considerable progress in recent years in refining and improving transportation system demand and performance models. Very little progress has been made, by contrast, into modeling the underlying land use patterns that determine transportation- system demand. The extent to which changes in land use policies will ultimately reduce congestion and air pollution, alter modal splits, and improve accessibility cannot be adequately gauged using today’s planning models and planning frameworks.
CUFM presents one-but by no means the only- approach to filling this critical gap. Beyond the immediately practical, the promise of models like this lies in three areas. First, they provide an effective framework for collecting, organizing, and understanding the millions of pieces of information now available that describe urban development and its effects. Second, because models lack imagination, they force researchers and model users to be explicit about their assumptions and about their knowledge of cause and effect. In complicated dynamic systems such as urban areas, this “what-if’ capability is extremely useful. Finally, efforts such as CUFM teach their users about the organization, structure, and dynamics of complicated urban systems. Used in this way models can be effective in public education and teaching and powerful tools for both land use and transportation planning.
Note:
The construction, testing, and use of the California Urban Futures Model was undertaken at the Institute of Urban and Regional Development with funds from the California Policy Seminar, the University of California Transportation Center, and the Association of Bay Area Governments. Key contributors to the development of CUFM have included Michael Teitz, Ted Bradshaw, Peter Hall, Edward Egan, Ayse Pamuk, Rolf Pendall, David Simpson, Qing Shen, Ming Zhao, and Ming Zhang.
Further Reading
John D. Landis, “The California Urban Futures Model: A New Generation of Metropolitan Simulation Models,” Environment and Planning B: Planning and Design Vol. 21 , 1994, pp. 399-420. UCTC No. 244.
John D. Landis and Ming Zhao, Pilot Study of Solano and Sonoma Land Use and Development Policy Alternatives (Berkeley: Institute of Urban and Regional Development, Working Paper 618, 1994). UCTC No. 245.
John D. Landis, Subhrajit Guhathakurta, and Ming Zhang, Capitalization of Transportation Investments into Single Family Home Prices: A Comparative Analysis of California Transit Systems and Highways (Berkeley: Institute of Urban and Regional Development, Working Paper 619, 1994). UCTC No. 246.
Michael Wegener, “Operational Urban Models: State of the Art,” Journal of the American Planning Association Vol. 60, No.1, 1994, pp. 17-30.