Some people seem to think there’s a universal Law of Traffic Congestion ruling that traffic expands to fill the space available to it. Thus, they believe it’s impossible to relieve highway congestion by building more roads.
Conventional wisdom aside, however, we simply don’t know whether new highway capacity affects travel behavior and, hence, traffic volumes. Advocates and opponents of new highway construction have debated this point for many construction projects in recent years-without the hard proof necessary to enlighten their debates.
Established planning procedures assume that most extra traffic on an enlarged road is reassigned from other parts of the network. Revisionists claim there are also sizable numbers of new trips and net increases in vehicle miles of travel (VM1). Thus advocates envision a fixed number of vehicles operating in improved traffic conditions, while opponents foresee more vehicles in conditions not much better, or perhaps even worse, than before.
Cross-sectional studies cannot deal with the direction of causality. Do roads generate traffic, or does traffic generate roads?
Everyone recognizes that road construction, particularly in urban areas, is very costly. Even if traffic inducement is omitted from the project analysis, there are difficult trade-offs between the benefits of reduced congestion and the costs, including severe an uncompensated social and environmental effects in addition to the monetary outlays. If induced traffic sharply reduces the benefits of reduced congestion, the trade-off tilts against urban road projects.
It’s clear that traffic has grown steadily in recent years and that urban lane-miles have been carrying a lot of new traffic. Indeed, the ratio of VMT to lane-miles on California and other state highways is larger than ever, and increasing continually. But it remains unclear whether increased road supply has caused that increased travel. To gauge this effect, we must compare the outcomes of different road-supply scenarios. For example, we might compare scenarios with and without a particular project, or, at a more macroscopic scale, scenarios in which higher or lower numbers of lanemiles are constructed.
Previous Research
Direct comparison of those kinds are impossible because we can’t perform controlled experiments. However, many efforts over the years have tried to measure or forecast the traffic-inducing effect of expanded road capacity. Starting in the 1940s, studies have attempted to measure induced traffic from individual projects. The approach was: (1) to gather time series of traffic counts on a corridor where a new road was being built, including observations both before and after project completion; (2) to estimate how traffic levels would have evolved in the absence of the project (the so-called “counterfactual scenario”); and (3) to estimate induced traffic by comparing the two scenarios.
Various methods have been used to estimate what traffic volumes would have occurred in the counterfactual scenario. In one early study, corridor traffic in the pre-project period closely tracked statewide gasoline sales; post-project gasoline sales were used to project traffic under the no-build scenario. More commonly, studies of individual projects have used “control corridors ” – corridors elsewhere in the same region whose traffic is unlikely to be affected by the project. Post-project traffic growth on the new road and on the control corridors are compared to estimate traffic inducement.
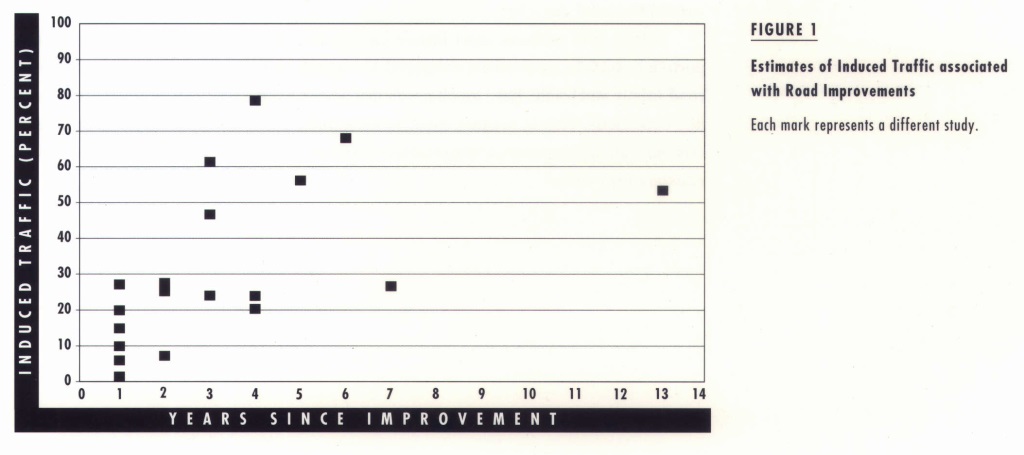
Figure 1 summarizes the results of several project-level studies of traffic inducement. Reported levels range from 0 to 30 percent increase one year after expansion and from 20 to 80 percent four years after. It seems that substantial volumes of additional traffic develop in most corridors after capacity is increased. There’s also a tendency for traffic to increase over time, a least during the first years following project completion. On the other hand, the level of estimated inducement is highly variable. Because the unit of analysis is a single corridor, it is impossible to determine whether induced traffic represents a net increase in regional VMT or whether it is merely redistributed from other parts of the region.
The relationship between road supply and traffic has also been studied through comparisons of different metropolitan areas. To see the basic logic of these cross-sectional studies, consider two regions, A and B. They are identical in all respects except their road supply and their VMT. If region A has x percent more lane-miles than region B, and if VMT in A is y percent greater than in region B, then it seems reasonable to attribute the VMT difference to the lane-mile difference. If we do so, we can go on to measure the sensitivity of VMT to lane miles as y /x. The percentage change in one variable that results in a one-percent change in another variable is known as the “elasticity.” Thus, y/x is the elasticity of VMT with respect to lane-miles.
Of course, the real world doesn’t contain identical regions, so most cross-sectional studies attempt to control for variables, other than lane-miles, that affect traffic. It is difficult to identify these variables. One obstacle is the scarcity of data. The larger the number of variables, the more observations are required before it is possible to isolate the effect of one factor from that of another. Moreover, certain variables that influence VMT may themselves be affected by road supply. For example, some have argued that more road supply discourages transit use, leading to reduced quality of transit service, which in turn further stimulates VMT. If this were true, and if we control for transit service quality, then we  would underestimate the effect of road supply on VMT. Similar issues emerge with regard to variables pertaining to urban form and density: To what extent are these variables determined by road supply? To what extent are they independent?
Cross-sectional studies also cannot deal with the direction of causality. Do roads generate traffic, or does traffic generate roads? Common sense suggests that causality runs both ways. If so, analyses that treat road supply as the cause and VMT as the result can yield misleading results. This problem is known as “simultaneity bias.”
In light of these problems it’s not surprising that cross-sectional studies have yielded widely varying estimates of the elasticity of VMT with respect to road-supply. The values range from as low as 0.13 to as high as 0.70. As a general rule, the studies yielding lower estimates have controlled for more variables. However, for reasons just explained, this does not necessarily mean that their results are more valid.
Regional transportation models are also routinely usedto assess the effect of road supply on traffic. However, the vast majority of these studies focus on site-specific situations instead of searching for generalizable relationships. Therefore, they are of limited use. Furthermore, most transportation models are not used in ways that fully reveal whether or how adding capacity can increase traffic. For example, most modeling studies assume that the number of trips to and from places like households and offices are independent of transportation supply. A sizable number also assume that origin-destination trip matrices, and even the modal distribution of trips, are independent of road capacity.
Finally, and perhaps most important, it’s far from clear that conventional transportation models, even when enhanced to capture numerous potential links between road supply and traffic, have much predictive power, even if they faithfully replicate baseline conditions. This is because these models make predictions that depend on numerous calibration parameters (“fudge factors”) and are valid only if these parameters remain constant over time.
A Panel Study
A group of us at the University of California, Berkeley, have recently been studying the relations between road supply and traffic in urban areas. Our approach differs from those of previous efforts because it relies on time series data for a set of metropolitan areas. This is known as a “panel” data set. Specifically, we used annual data from thirty urban counties in the state of California from 1973 to 1990. The thirty counties constitute fourteen metropolitan areas, ranging in population from 150 thousand to 14 million. We analyzed the data at both the county and the metropolitan levels.
Our analysis focuses on state highway VMT (roughly half of total VMT in the state) and on the relationship of VMT to the supply of state highways, as measured in lane-miles. Because California has a systematic program for counting traffic on state highways, more and better data are available for state-highway VMT than for total VMT, which are based on gasoline sales and available at the county level for only a few recent years. However, we’ve also analyzed the limited data for total VMT to determine whether induced VMT on the state highway system represents a net increase in traffic or only redistributed travel from other roads.
Panel-data permit a more rigorous analysis than is possible with cross-sectional data for a single year. Cross-sectional studies must explicitly  include all regional variables that independently influence traffic, but we can absorb many of these variables into a single region-specific correction factor. Similarly, time-specific variables that affect traffic in all regions, such as the OPEC oil embargo, are captured using a time-specific factor. Statisticians refer to these factors as “fixed effects.”
In addition to controlling for a host of region-specific and time-specific variables, by using fixed effects we reduce the potential problem of simultaneity bias. To see how this is so, compare Los Angeles and San Francisco. Los Angeles has more lane-miles, and VMT is greater there. It’s likely that over the long run, each of these differences affects the other. Thus a cross-sectional comparison between them is subject to simultaneity bias.
However, in a panel study, the results depend on the correlation between year-to-year variations in traffic and in year-to-year variation in lane-miles. Because road projects require many years to plan and implement, it is virtually impossible for road supply to respond to VMT on a year-to-year basis. So, if lane-miles and VMT grow faster in Los Angeles over a short span of years, this growth is probably not the result of road supply responding to traffic. Therefore, by employing panel analysis, we could treat road supply as a strictly causal variable.
Finally, because our data set covers a considerable number of years, it is possible to explore the dynamics of traffic response to road supply. Both common sense and our research findings suggest that the positive influence of added lane-miles on VMT occurs gradually. Travelers, households, business firms, and others gradually adjust their behavior in response to the added capacity. Some adjustments, such as route shifting, can occur soon after lanes are added; others, such as changes in activity locations, may take several years. To analyze the dynamics of the adjustment process, we relate regional VMT in a given year to regional lane-mileage in several previous years. Models with this feature are known as “distributed lag” models.
Lane-Miles Induce New Traffic
Our study, based on such a distributed lag model, found that adding lane-miles does induce substantial new traffic. At the county level we find that a 1.0 percent increase in lane-miles soon induces an immediate 0.2 percent increase in traffic, building to a 0.6 percent increase within two years after the lane-miles are added. At the metropolitan level, the immediate effect is also about 0.2 percent, building to a 0.9 percent increase four years after. Therefore, it appears that adding road capacity does little to decrease congestion because of the substantial induced traffic.
Why is the lane-mile elasticity of VMT higher at the metropolitan level? One explanation is that adding lane-miles in one county induces traffic in neighboring counties since many trips cross county lines. Therefore, future studies of this kind should cover wide geographic areas.
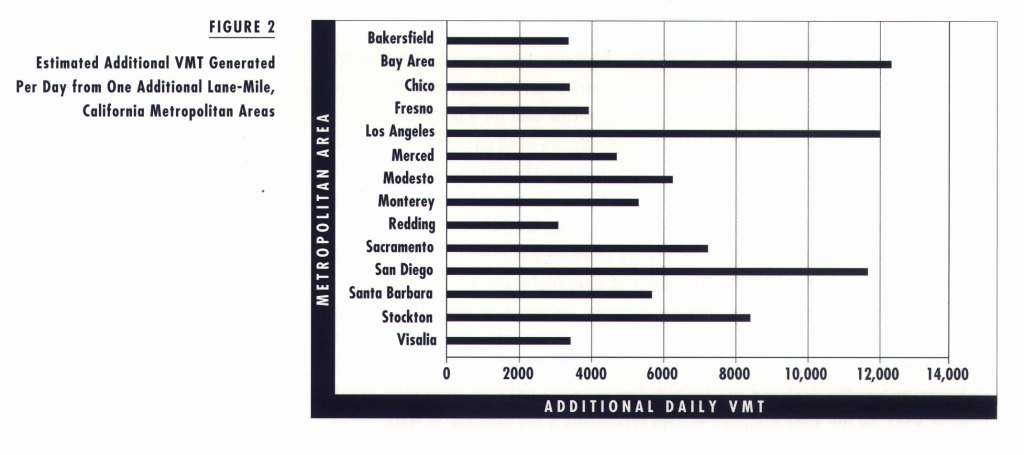
We used our lane-mile elasticity measures to project additional daily VMT expected to result from a marginal lane-mile for the fourteen metropolitan areas in our study (see Figure 2). In the Bay Area, Los Angeles, and San Diego we expect an additional lane-mile to raise VMT by about 12 thousand per day. Among the other regions, the increases range from 3 to 8 thousand. Assuming a capacity of 2000 vehicles per lane per hour, the induced traffic would be equivalent to filling the added lane for six hours per day.
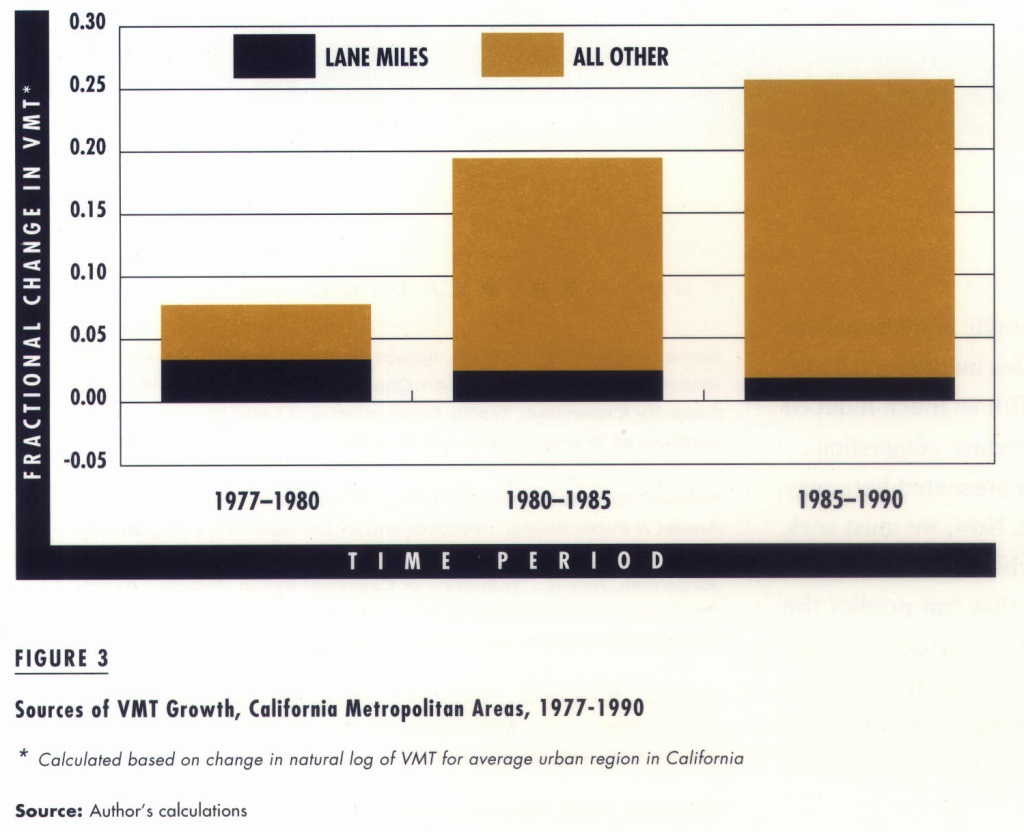
We also estimated the contributions to VMT growth from various sources during three periods: 1977-80, 1980-85, and 1985-90. For each period we calculated the average increase in VMT for fourteen metropolitan areas. We attributed VMT growth to population, per capita income, highway-lane miles, and “other” factors, including declining real prices of gasoline, increasing female employment, declining transit subsidies, and other trends affecting VMT in all regions.
Figure 3 shows the results of this analysis. The most consistent source of VMT growth has been population growth. Most recently, however, “other” factors became increasingly important. Lane-mile growth has become progressively less important, reflecting the continuing decline in numbers of lane-miles added to the system in recent years. Per capita income has played a modest role, reflecting both the recent stagnation in real family incomes and the modest effects that rising incomes among wealthy households have had on car ownership and, hence, on VMT.
Bear in mind that our findings pertain to VMT on state highways only. An obvious question is whether the state highway traffic induced by added lane-miles comes from non-state roads. Our ability to answer this question is hampered by the limited reliability of data on total VMT. Our analysis suggests that state highway lane-miles do not significantly affect VMT on off-state highways. However, because county and local roads are almost always used for to getting on and off state highways, increased state highway traffic can also add to non-state facilities. On balance, it appears that these two effects roughly cancel out.
Conclusion
New roads generate substantial new traffic in metropolitan regions. A 1.0 percent increase in lane miles induces a 0.9 percent increase in VMT within five years. With so much induced traffic, adding road capacity does little to reduce congestion. However, the aggregate relationships presented here may not hold for an individual highway project. Now, we must seek convergence between macro-studies such as ours and more detailed and elaborate planning models that can predict the effects of specific road improvements. Without further and complementary macro- and micro-analyses, our ability to assess urban transportation improvements will remain limited. But at least in metropolitan areas, it seems that the Law of Traffic Congestion has been upheld.
Further Readings
Hansen, Mark, David Gillen, Allison Dobbins, Yuanlin Huang, and Mohnish Puvathingal, “The Air Quality Impacts of Urban Highway Capacity Expansion: Traffic Generation and Land Use Change,” Institute of Transportation Studies, No. UCB-ITS-RR-93-5, 1993.
Hansen, Mark and Yuanlin Huang, “Road Supply and Traffic in Urban Areas: A Panel Study,” forthcoming In Transportation Research.
Jorgensen, Roy E., “Influence of Expressways in Diverting Traffic from Alternate Routes and Generating New Traffic,” Proceedings of the 27th Annual Highway Research Board, 1947.
Newman, Peter W.G., ” Gasoline Consumption and Cities: A Comparison of U.S. Cities with a Global Survey,” Journal of the American Planning Association, Vol. 55, No. 1, 1989.
Pells, S.R., “User Response to New Road Capacity: A Review of Published Evidence,” Institute for Transport, University of Leeds, England, Working Paper 283, 1989.