A widely cited report says transportation costs are increasing and comprise a much larger share of expenditures in lower-than in higher-income households. The report, Transportation Costs and the American Dream, published by the Surface Transportation Policy Project in 2001, blames automobiles and says that rising transportation costs are hindering home ownership. However, the facts do not support this conclusion.
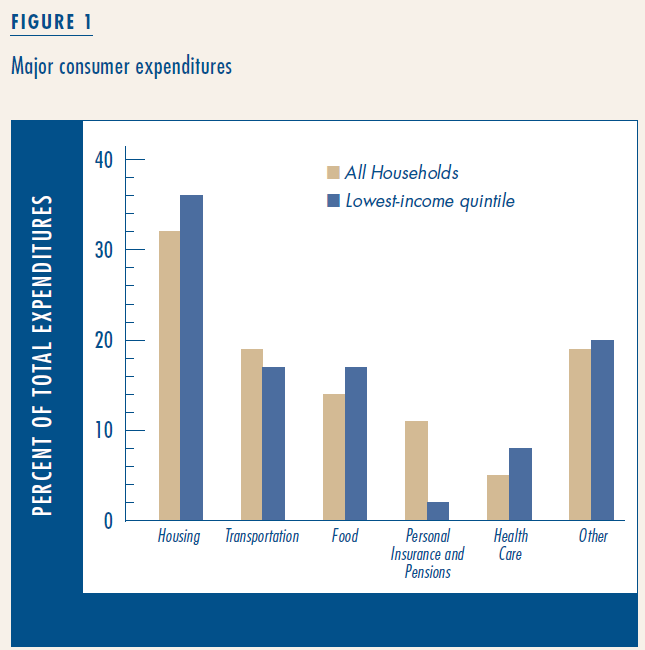
Expenditure data from the Bureau of Labor Statistics’s (BLS) Consumer Expenditure Survey reveal that low-income households actually spend slightly less than high-income households on transportation, a pattern that has held since the early 1980s. Figure 1 shows the distribution of expenditures for all households and compares them with households in the bottom income quintile. The graph shows transportation expenses are, indeed, a significant expenditure for everyone, but that low-income households spend a slightly smaller percentage on transportation than all households (and a higher percentage on housing).
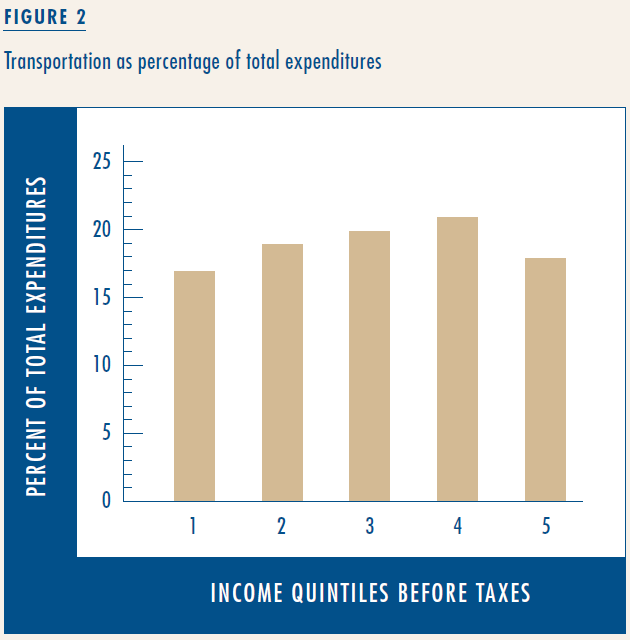 This finding is underscored in Figure 2, which shows transportation expenditures as a percentage of total expenditures by income quintile. Transportation comprises 17 percent of the total expenditures among households in the lowest income group, a figure surprisingly similar to, albeit less than, that of higher income groups, which spend between 18 and 21 percent on transportation.
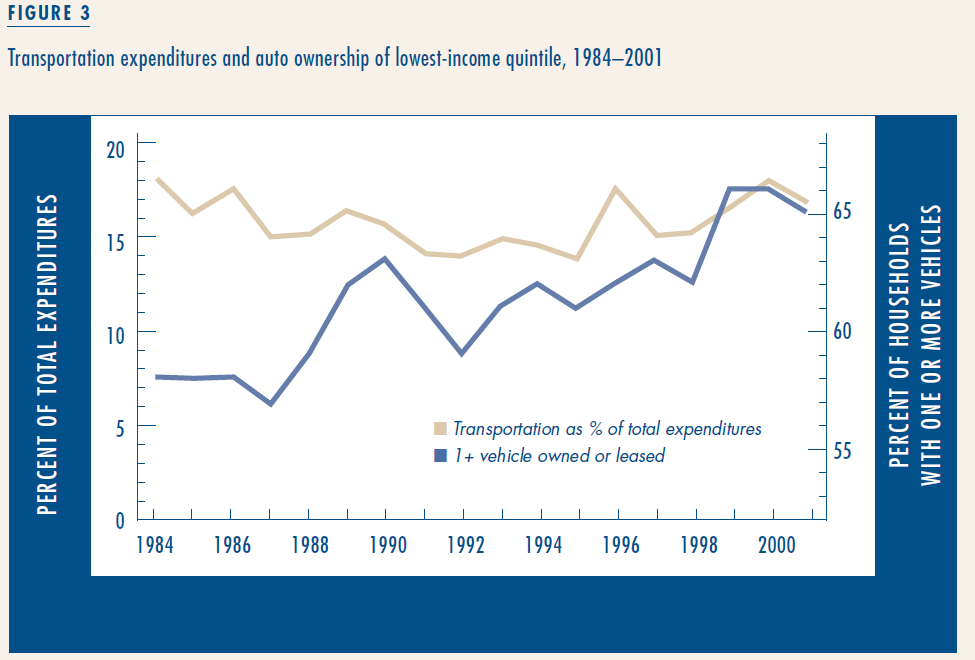
As Figure 3 shows, the percentage of low-income households with at least one vehicle increased steadily from 58 percent in 1984 to 65 percent in 2001. For most of this period, low-income households spent less and less on transportation. Although in recent years transportation expenditures have increased, they remain lower today than they were in 1984.
 These figures are based on expenditure data. One could argue that income, rather than expenditures, is a more appropriate basis, since some low-income families incur debt, so their expenditures exceed their incomes. Expenditure data do not account for debt, but in the Consumer Expenditure Survey, neither do income data. This is because, according to the BLS, households consistently underreport their income. As a consequence, total expenses for the bottom income quintile in BLS data are approximately 240 percent greater than total post-tax income. Obviously, it is not possible for expenditures to exceed income by nearly two and a half times.
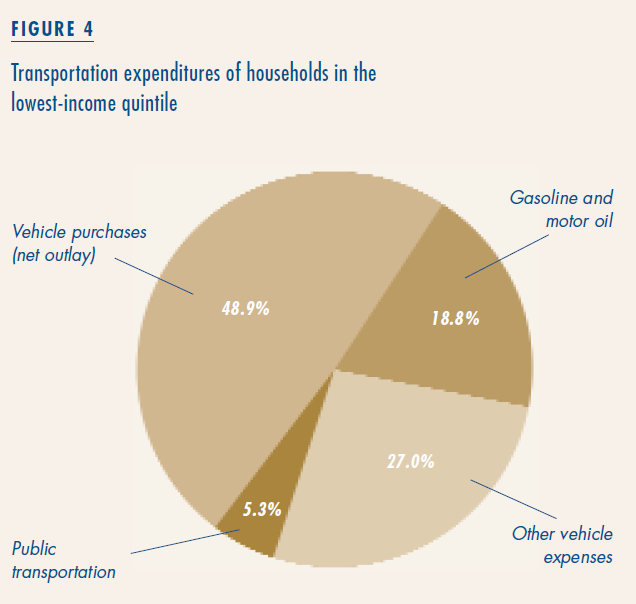 Figure 4 shows that the vast majority of transportation-related expenses are associated with cars. This is no surprise, since most low-income adults travel in cars (76 percent of all trips by those with incomes of less than $20,000). In 2001, on average, poor households spent $3,200 on transportation, including only $405 (or just over five percent) on public transportation.
Are transportation costs—particularly costs associated with automobiles—a major barrier to economic opportunity among the poor? Simple cost comparisons fall short of answering this question. The fact that low-income households spend, on average, $3,000 a year on vehicle-related expenses does not, by itself, suggest a problem. We cannot separate the costs of automobiles from their benefits; and cars provide benefits, particularly in auto-oriented metropolitan areas. And transportation costs cannot be separated from housing location decisions. Households make trade-offs between housing and transportation costs that include time costs—yet another dimension that gets lost in a simple comparison of expenditures.
There’s no question that if low-income families spent less on transportation, they could spend more on other things such as housing, food, and health care. But one cannot draw conclusions regarding the burdens of transportation costs without also considering the benefits of transportation expenditures. Claims that excessive transportation costs and, more specifically, automobile ownership are directly responsible for reducing home ownership among low-income households are not supported by the data.