Gravitas
 The research I’d like to describe was initiated in response to the travel models that were available in 1970. At that time, the dominant tool for urban transportation planning was the gravity model. I thought it was just too coarse to yield sensitive predictions of travelers’ choices among modes. Besides, because it was nonbehavioral, it was a poor fit for those of us brought up on economic theory. Before recounting the exploratory path that led to discrete-choice models, I should first say something about gravity models.
Here’s how they work. You divide an urban area up into small zones. You do a massive household survey to  determine how often people travel, and the origin and destination zones of their trips. You aggregate these counts to establish a flow of travelers between zones. You then define these flows as proportional to the zone sizes, measured say by the number of people or the number of jobs they contain, and inversely proportional to travel time between zones. This mimics the physicist’s equation for the gravitational attraction between two bodies, hence the name “gravity model.” In these models, travel time was often replaced by some generalized measure of travel cost, including out-of-pocket cost and the value of time. For transportation policy, one could tweak the generalized travel cost to reflect an initiative such as added freeway capacity and predict the resulting flows through the system.
 Gravity models were, and still are, a useful tool for tracking and projecting network flows, but they have two major limitations. First, they do not use all the information contained in the data collected for their calibration. By aggregating data, they lose the detailed associations between individual circumstances and travel choices, like whether a car is available at the time a trip has to be made. If you can include this information, you can do a better job of predicting what individuals will do, and this can improve the accuracy of your forecasts. Second, there are lots of transportation policies one would like to consider, but gravity models are unable to predict their effects. What happens if you reroute a bus line, or introduce a new fixed-rail rapid transit system? It’s very hard to get a gravity model to give you a relevant answer.
My proposal in 1971 was to forecast travel demand at the level of the individual rather than at the level of the traffic zone. We would collect data on individual travelers and trips and model the choices they made in response to the transportation environment they faced. If we could articulate the environment in sufficient detail, say with information on the number of blocks to a bus stop, or the amount of waiting time a trip would require, and so forth, then we should be able to forecast how individuals would change their behavior in response to policy alternatives like changing bus routes or headways. Data on individual trips would be a lot noisier than aggregated interzonal flows. But they would contain the detailed links from circumstance to  behavioral response that one must understand to do a good job of predicting response to fine-grained, innovative transportation policy initiatives.
Choices
One feature of travel-demand behavior at the individual level is especially important for modeling and statistical analysis. Travel choices are discrete. You either go or you don’t, you go either by car or by bus, you go either to Safeway or to another grocery. In 1971, economists had no track record for successfully forecasting demand at this level. Worse, they had no theory for such choices and no models or statistical tools for forecasting them. What economists did have was a general proposition that people make decisions to advance their self-interest. This proposition was developed into a theory of how consumers would adjust levels of demand for various goods in response to changes in income and prices.
 In the mid-1960s when I started thinking about these problems, I observed that in a population with heterogeneous tastes, self-interest would lead some to one discrete choice and others to a different one. The attributes of the different alternatives, such as their costs, would determine a tipping point in the distribution of tastes where people would switch from one alternative to another. Thus, the same reasoning that led to the indifference curves and substitution effects found in economics textbooks would, in a world with discrete alternatives and a distribution of tastes, lead to probabilities of choice that depend on economic variables and the attributes of each option in a predictable way. Drawing on work in psychology by Thurstone, Marschak, and Luce, I devised a practical way to implement these ideas in empirical models.
Today, this is called discrete-choice analysis or the theory of random utility maximization, and the original models are called multinomial logit models. In 1971, I worked out a way to apply these methods to the study of travel-demand behavior, estimating work and nonwork travel-demand models for Pittsburgh, PA, including trip generation, destination, and mode choice. I then looked for a natural experiment that would give this modeling framework an acid test, to see whether it had the ability to forecast demand for an entirely new transportation mode.
At that time, the Bay Area Rapid Transit electric railsystem was under construction in San Francisco, scheduled to open soon, and I set as my objective forecasting BART demand before it began operation. My team would then revisit the sampled subjects after BART opened to determine how well the forecasts worked. We conducted a survey in 1972, and then obtained an NSF grant with the cooperation of the Metropolitan Transportation Commission that allowed us to set up the Urban Travel Demand Forecasting Project, conduct a larger survey in 1973, and reinterview the same people in 1975 after BART was running. Our motto was “Zones don’t travel; people travel.”
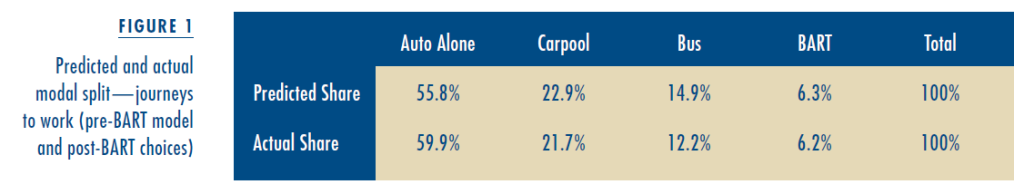
How did we do? The official forecast of BART patronage in 1973 foresaw it carrying about 15 percent of all work trips. This forecast was based very loosely on gravity model calculations, with a dollop of BART boosterism. Based on our survey and models, we forecast that BART would carry 6.3 percent of work trips. In 1975, BART was carrying 6.2 percent of work trips. Thus, we turned out to be spot on.
 However, to some extent, we were right for the wrong reasons. We overestimated people’s willingness to walk to public transport, so we thought that auto or bus access to BART was less important than it has turned out to be. We overestimated bus use in the presence of the BART system. One of the things we have learned since the 1970s is that by asking people a lot more about what they say they would do in well-structured hypothetical-choice settings, we can flesh out our description of how innovative products are perceived, and do a much better job of forecasting their demand. We economists have also learned over the past several decades something that the rest of you knew all along—that people are less single-minded, consistent, and relentless in their pursuit of self-interest than simple economic theories would suggest. There are a number of behavioral reasons for this, but it is convenient to lump most of them under the rubric of mistakes in perception.
Perception
There is convincing evidence that people’s perceptions control their choices and that these perceptions are sensitive  to context, and sometimes volatile. That’s particularly so when it comes to making choices among unfamiliar alternatives, in situations where probabilistic and statistical thinking is called for, or when some attributes of alternatives are screened from direct attention. For example, people are more sensitive to out-of- pocket costs, such as parking charges, than they are to indirect costs, such as vehicle depreciation. This trait is consistent with behavior in many other arenas where people have to evaluate trade-offs between immediate and delayed gratification.
 One of the interesting scientific issues is whether the evidence that people are pulled about by their perceptions means they don’t consistently pursue self-interest. A favorite argument of economists is that the market disciplines inconsistent behavior; if people are inconsistent in their perceptions about the choices they make, then some sharp operator will figure out how to turn them into a money pump. In fact, it is clear that while this does happen in some very active markets such as financial markets, it is not universal. Further, people often develop self-protective rules to avoid exploitation.
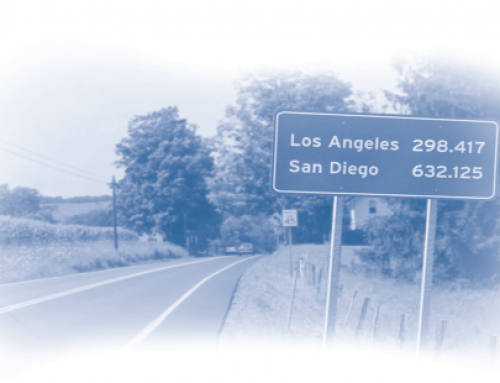
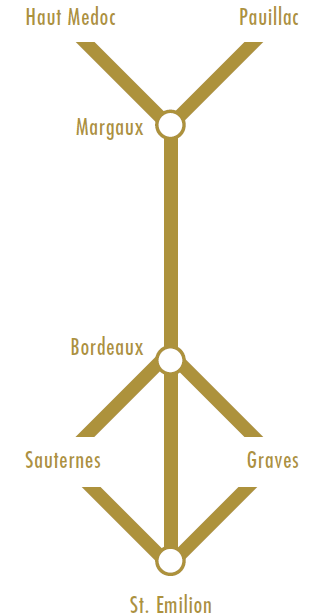 Here’s an example. Consider a simplified road map of the wine-producing regions near Bordeaux.
Bordeaux appears to be closer to St. Emilion than to Margaux. However, you will immediately recognize that this is a version of the classic Muller-Lyer optical illusion in which the distances are actually the same. Could this illusion affect the behavior of wine-lovers? Do travelers arriving in Bordeaux misread their maps, and flock to St. Emilion, even if they prefer the wines of Margaux? In fact, the diagram was inspired by a brochure produced by the commune of St. Emilion, and St. Emilion is more crowded than Margaux, but I doubt this is the result of an optical illusion. We learn to be suspicious of our perceptions, and adopt conservative behavioral strategies, such as adding up distances on maps when we are planning trips, that prevent us from deviating too far from our self-interest. As a consequence, transportation forecasts based on simple models of maximization of self-interest will often be approximately right, not necessarily because that’s what people consciously do—or even, given their perceptual limitations, can do— but rather because they learn to adopt rules to avoid behavior that is clearly inconsistent with self-interest.
Over the 25 years that have passed since the Urban Travel Demand Forecasting Project was  completed, discrete-choice analysis has become a standard tool not only in transportation planning, but also in marketing, finance, political science, and applied economics. It met a need. Today, if you go to London, Paris, or Hong Kong, you’ll find that these tools have been integrated into transportation system facilities planning and operations.
Of course, as they say, no one is a saint in his own country. As far as I know, BART management is unaware that the tools available for transportation policy analysis have changed since 1970.
Further Readings
Daniel McFadden, with Thomas A. Domencich. Urban Travel Demand: A Behavioral Analysis. North Holland: Amsterdam, 1975. Reprinted by The Blackstone Company: Mount Pleasant, MI. 1996.
Daniel McFadden, “The Measurement of Urban Travel Demand,” Journal of Public Economics, vol. 3, no. 4, pp. 303–328, 1974.
Daniel McFadden, “The Theory and Practice of Disaggregate Demand Forecasting for Various Modes of Urban Transportation,” in Emerging Transportation Planning Methods, U.S. Department of Transportation DOT-RSPA-DPB-50-78-2, August 1978. Reprinted in Tae Hoon Oum, et al. (eds.), Transport Economics: Selected Readings, pp. 51–80. Seoul Press, Seoul. 1995.
Daniel McFadden, “Overview and Summary: Urban Travel Demand Forecasting Project,” with Fred Reid, Antti Talvitie, Michael Johnson, and Associates. The Urban Travel Demand Forecasting Project,Final Report, vol. 1. Institute of Transportation Studies: University of California, Berkeley. June 1979.
Daniel McFadden, “Disaggregate Behavioral Travel Demand’s RUM Side: A 30-Year Retrospective,” The Leading Edge of Travel Behavior Research, David Heschner (ed.). Pergamon Press: Oxford, 2001.