Beware of certainty where none exists.
– Daniel Patrick Moynihan
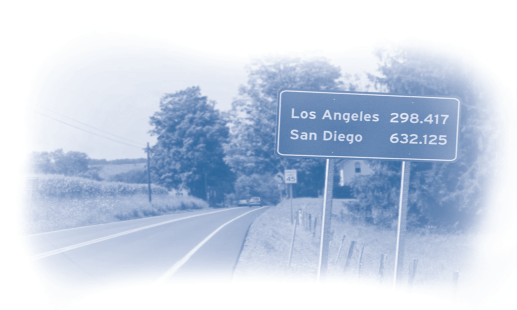
How far is it from San Diego to San Francisco? An estimate of 632.125 miles is precise—but not accurate. An estimate of somewhere between 400 and 500 miles is less precise but more accurate because the correct answer is 460 miles. Nevertheless, if you had no idea how far it is from San Diego to San Francisco, whom would you believe: someone who confidently says 632.125 miles, or someone who tentatively says somewhere between 400 and 500 miles? Probably the first, because precision implies certainty.
Although reporting estimates with extreme precision indicates confidence in their accuracy, transportation engineers and urban planners often use precise numbers to report uncertain estimates. To illustrate this practice, I will draw on two manuals published by the Institute of Transportation Engineers (ITE)— Parking Generation and Trip Generation. These manuals have enormous practical consequences for transportation and land use. Urban planners rely on parking generation rates to establish off-street parking requirements, and transportation planners rely on trip generation rates to predict traffic effects of proposed developments. Many transportation models also incorporate trip generation rates. Yet a close look at the data shows that unwarranted trust in these precise but uncertain estimates of travel behavior can lead to bad transportation, parking, and land-use policies.
Trip Generation
Trip Generation reports the number of vehicle trips as a function of land use. The sixth (and most recent) edition of Trip Generation (1997) describes the data base used to estimate trip generation rates:
This document is based on more than 3,750 trip generation studies submitted to the Institute by public agencies, developers, consulting firms, and associations. . . . Data were primarily collected at suburban localities with little or no transit service, nearby pedestrian amenities, or travel demand management (TDM) programs.
ITE says nothing about the price of parking, but the 1990 Nationwide Personal Transportation Survey found that parking is free for 99 percent of vehicle trips in the US, so the surveyed sites probably offer free parking. Of the 1,515 trip generation rates, half are based on five or fewer studies, and 23 percent are based on a single study. Trip generation rates thus typically measure the number of vehicle trips observed at a few suburban sites with free parking but no public transit, no nearby pedestrian amenities, and no TDM programs. Urban planners who rely on these trip generation rates as guides when designing transportation systems are therefore reinforcing automobile dependency.
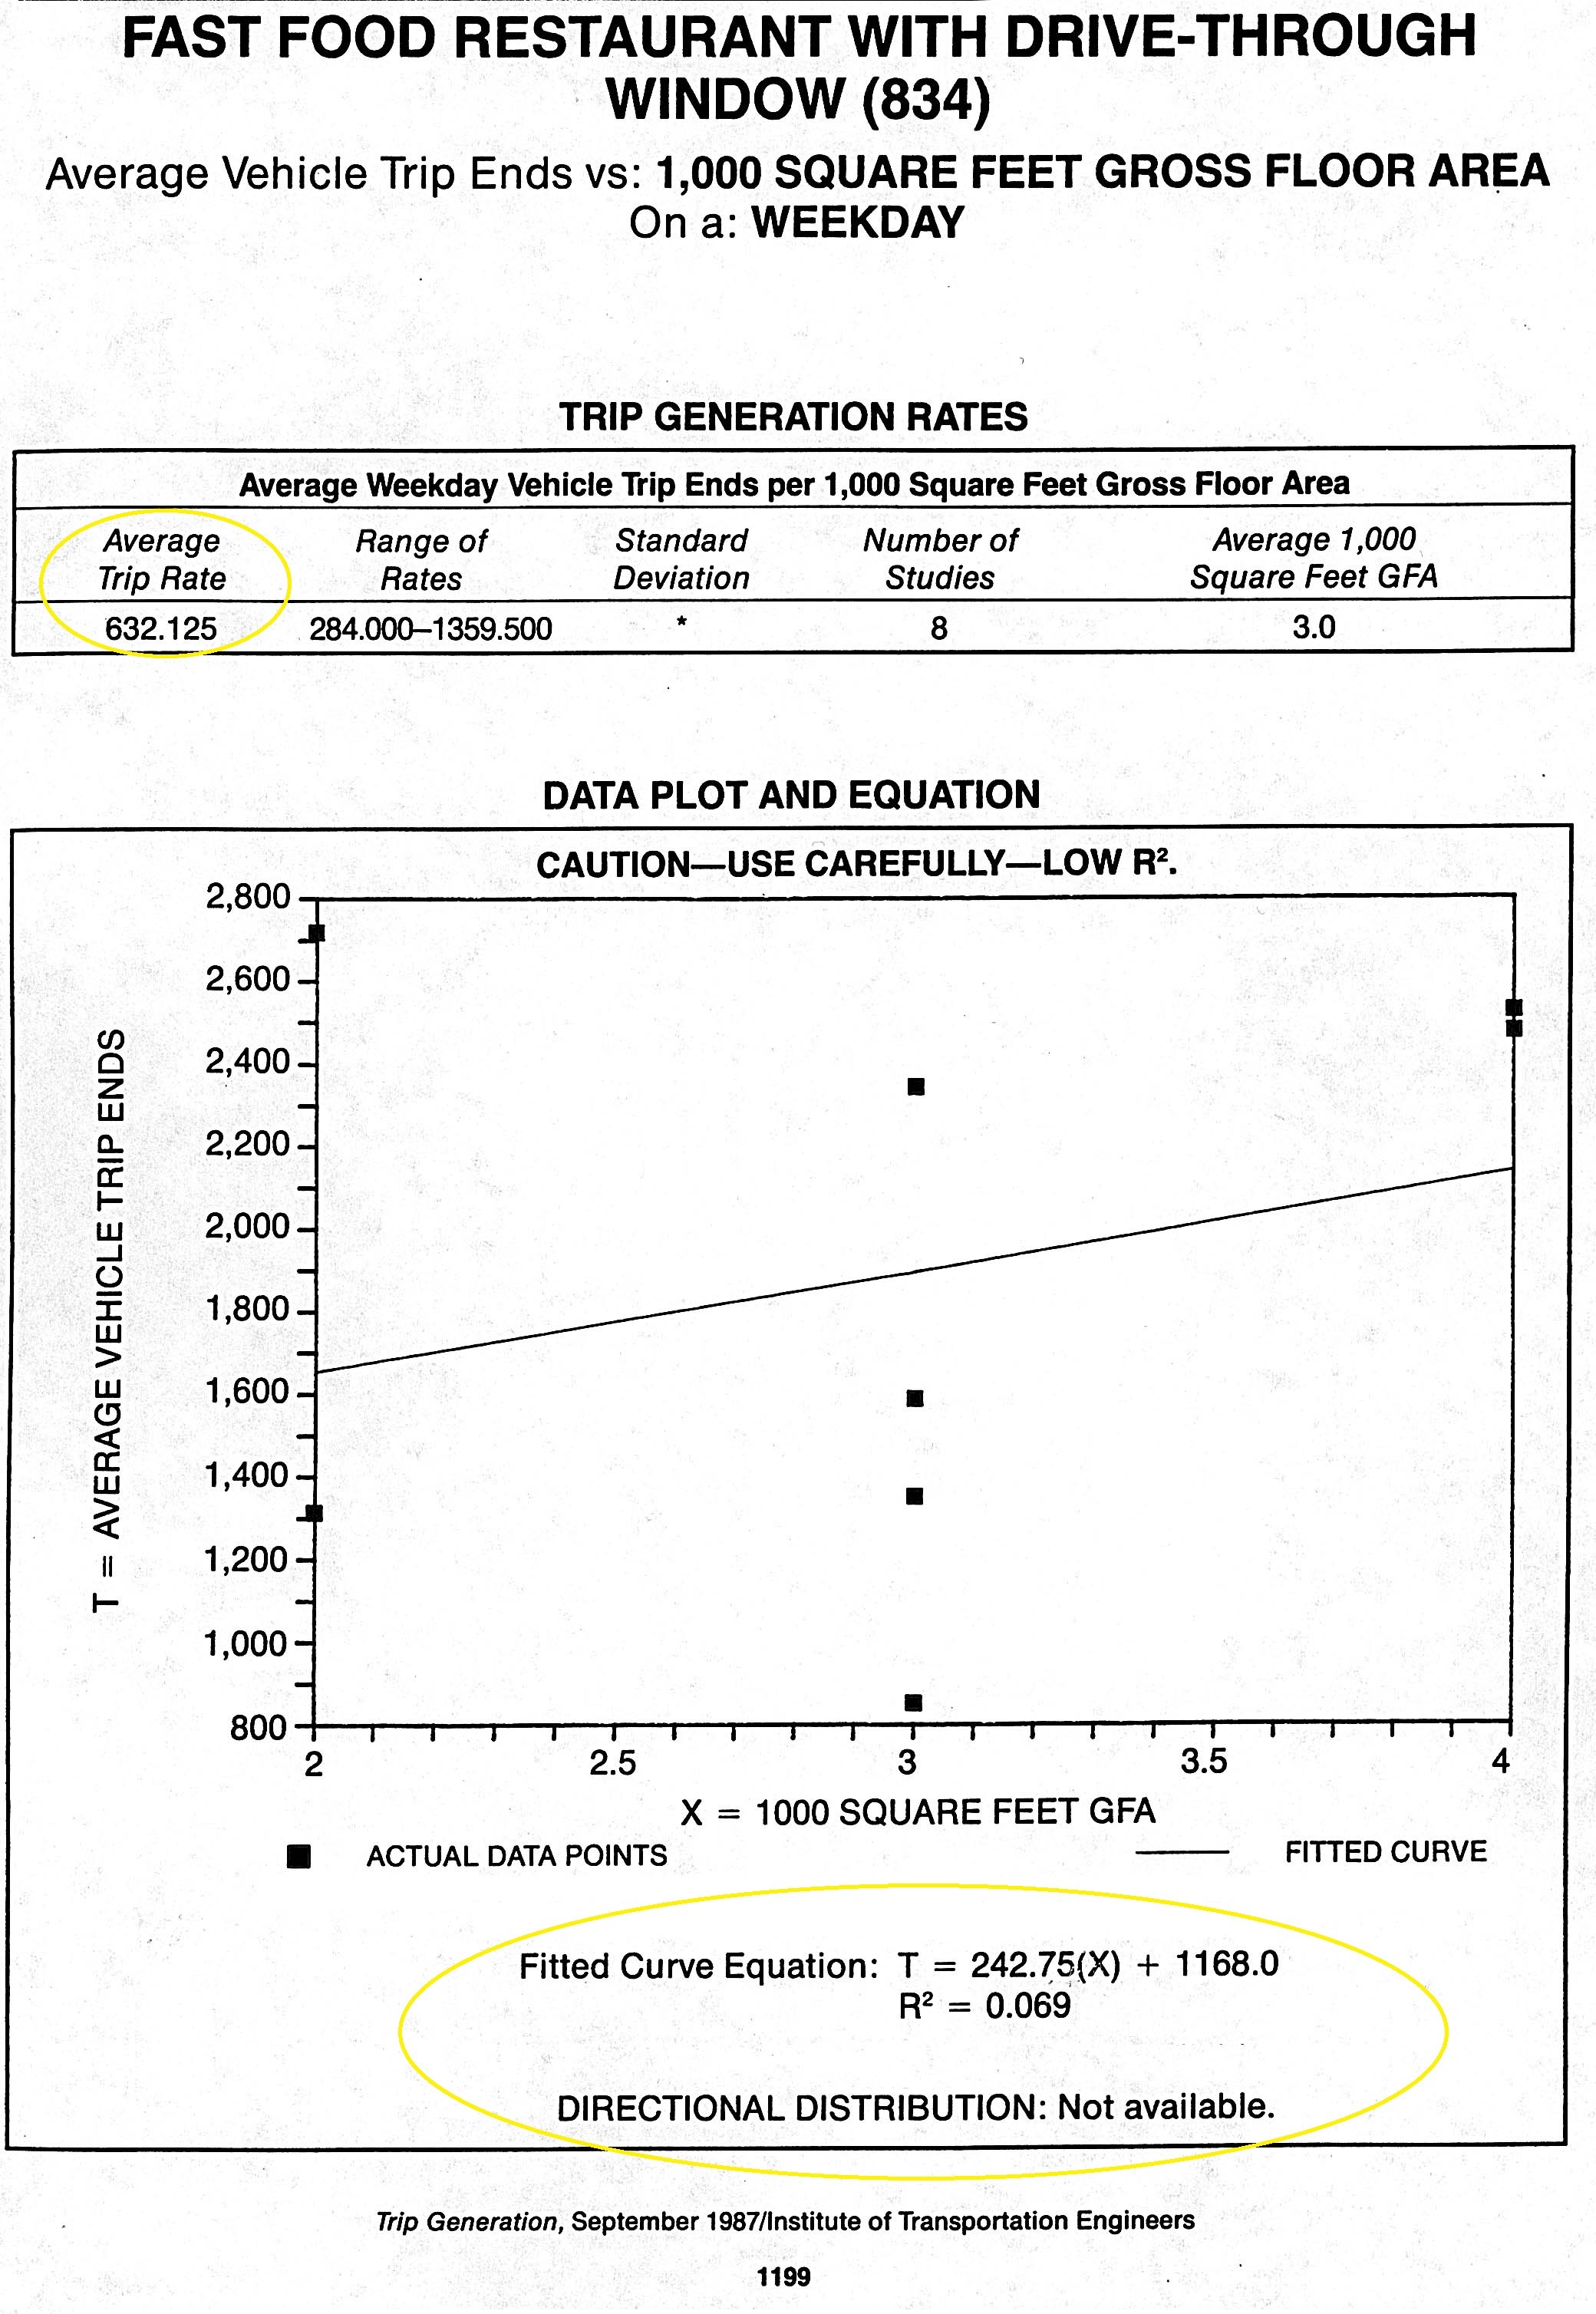
Figure 1 is a facsimile of a page from the fourth edition of Trip Generation (1987). It reports the number of vehicle trips to and from fast food restaurants on a weekday. Each point in the figure represents a single restaurant, showing the average number of vehicle trips it generates and its floor area. Dividing the number of vehicle trips by the floor area gives the trip generation rate for that restaurant, and the rates range from 284 to 1,359.5 trips per 1,000 square feet for the eight studies.
A glance at the figure suggests that vehicle trips are unrelated to floor area in this sample, and the equation at the bottom of the figure (R2 = 0.069) confirms this impression. Nevertheless, ITE reports the sample’s average trip generation rate (which urban planners normally interpret as the relationship between floor area and vehicle trips) as precisely 632.125 trips per day per 1,000 square feet. The trip generation rate looks accurate because it is so precise, but the precision is misleading. Few transportation or land-use decisions would be changed if ITE reported the trip generation rate as 632 rather than 632.125 trips per 1,000 square feet, so the three-decimal-point precision serves no purpose.
Reporting an average rate suggests that larger restaurants generate more vehicle trips—but according to the figure, the smallest restaurant generated the most trips, and a mid-sized restaurant generated the fewest. The page does contain the warning, “Caution—Use Carefully—Low R2,” which is good advice because the data show no relationship between vehicle trips and floor area. Nevertheless, the average trip generation rate is still reported at the top of the page as if it were relevant. Despite its precision, the number is far too uncertain to use in transportation planning.
Parking Generation
Parking generation rates suffer from similar uncertainty. Parking Generation reports the average peak parking occupancy as a function of land use. The most recent edition of Parking Generation (1987) explains the survey process:
A vast majority of the data . . . is derived from suburban developments with little or no significant transit ridership. . . . The ideal site for obtaining reliable parking generation data would . . . contain ample, convenient parking facilities for the exclusive use of the traffic generated by the site. . . . The objective of the survey is to count the number of vehicles parked at the time of peak parking demand.
Half the 101 parking generation rates in the second edition are based on four or fewer surveys, and 22 percent are based on a single survey. Therefore, parking generation rates typically measure the peak parking demand observed at a few suburban sites with ample free parking and no public transit. Urban planners who use these rates to set off-street parking requirements are therefore planning a city where people will drive wherever they go and park free when they get there.
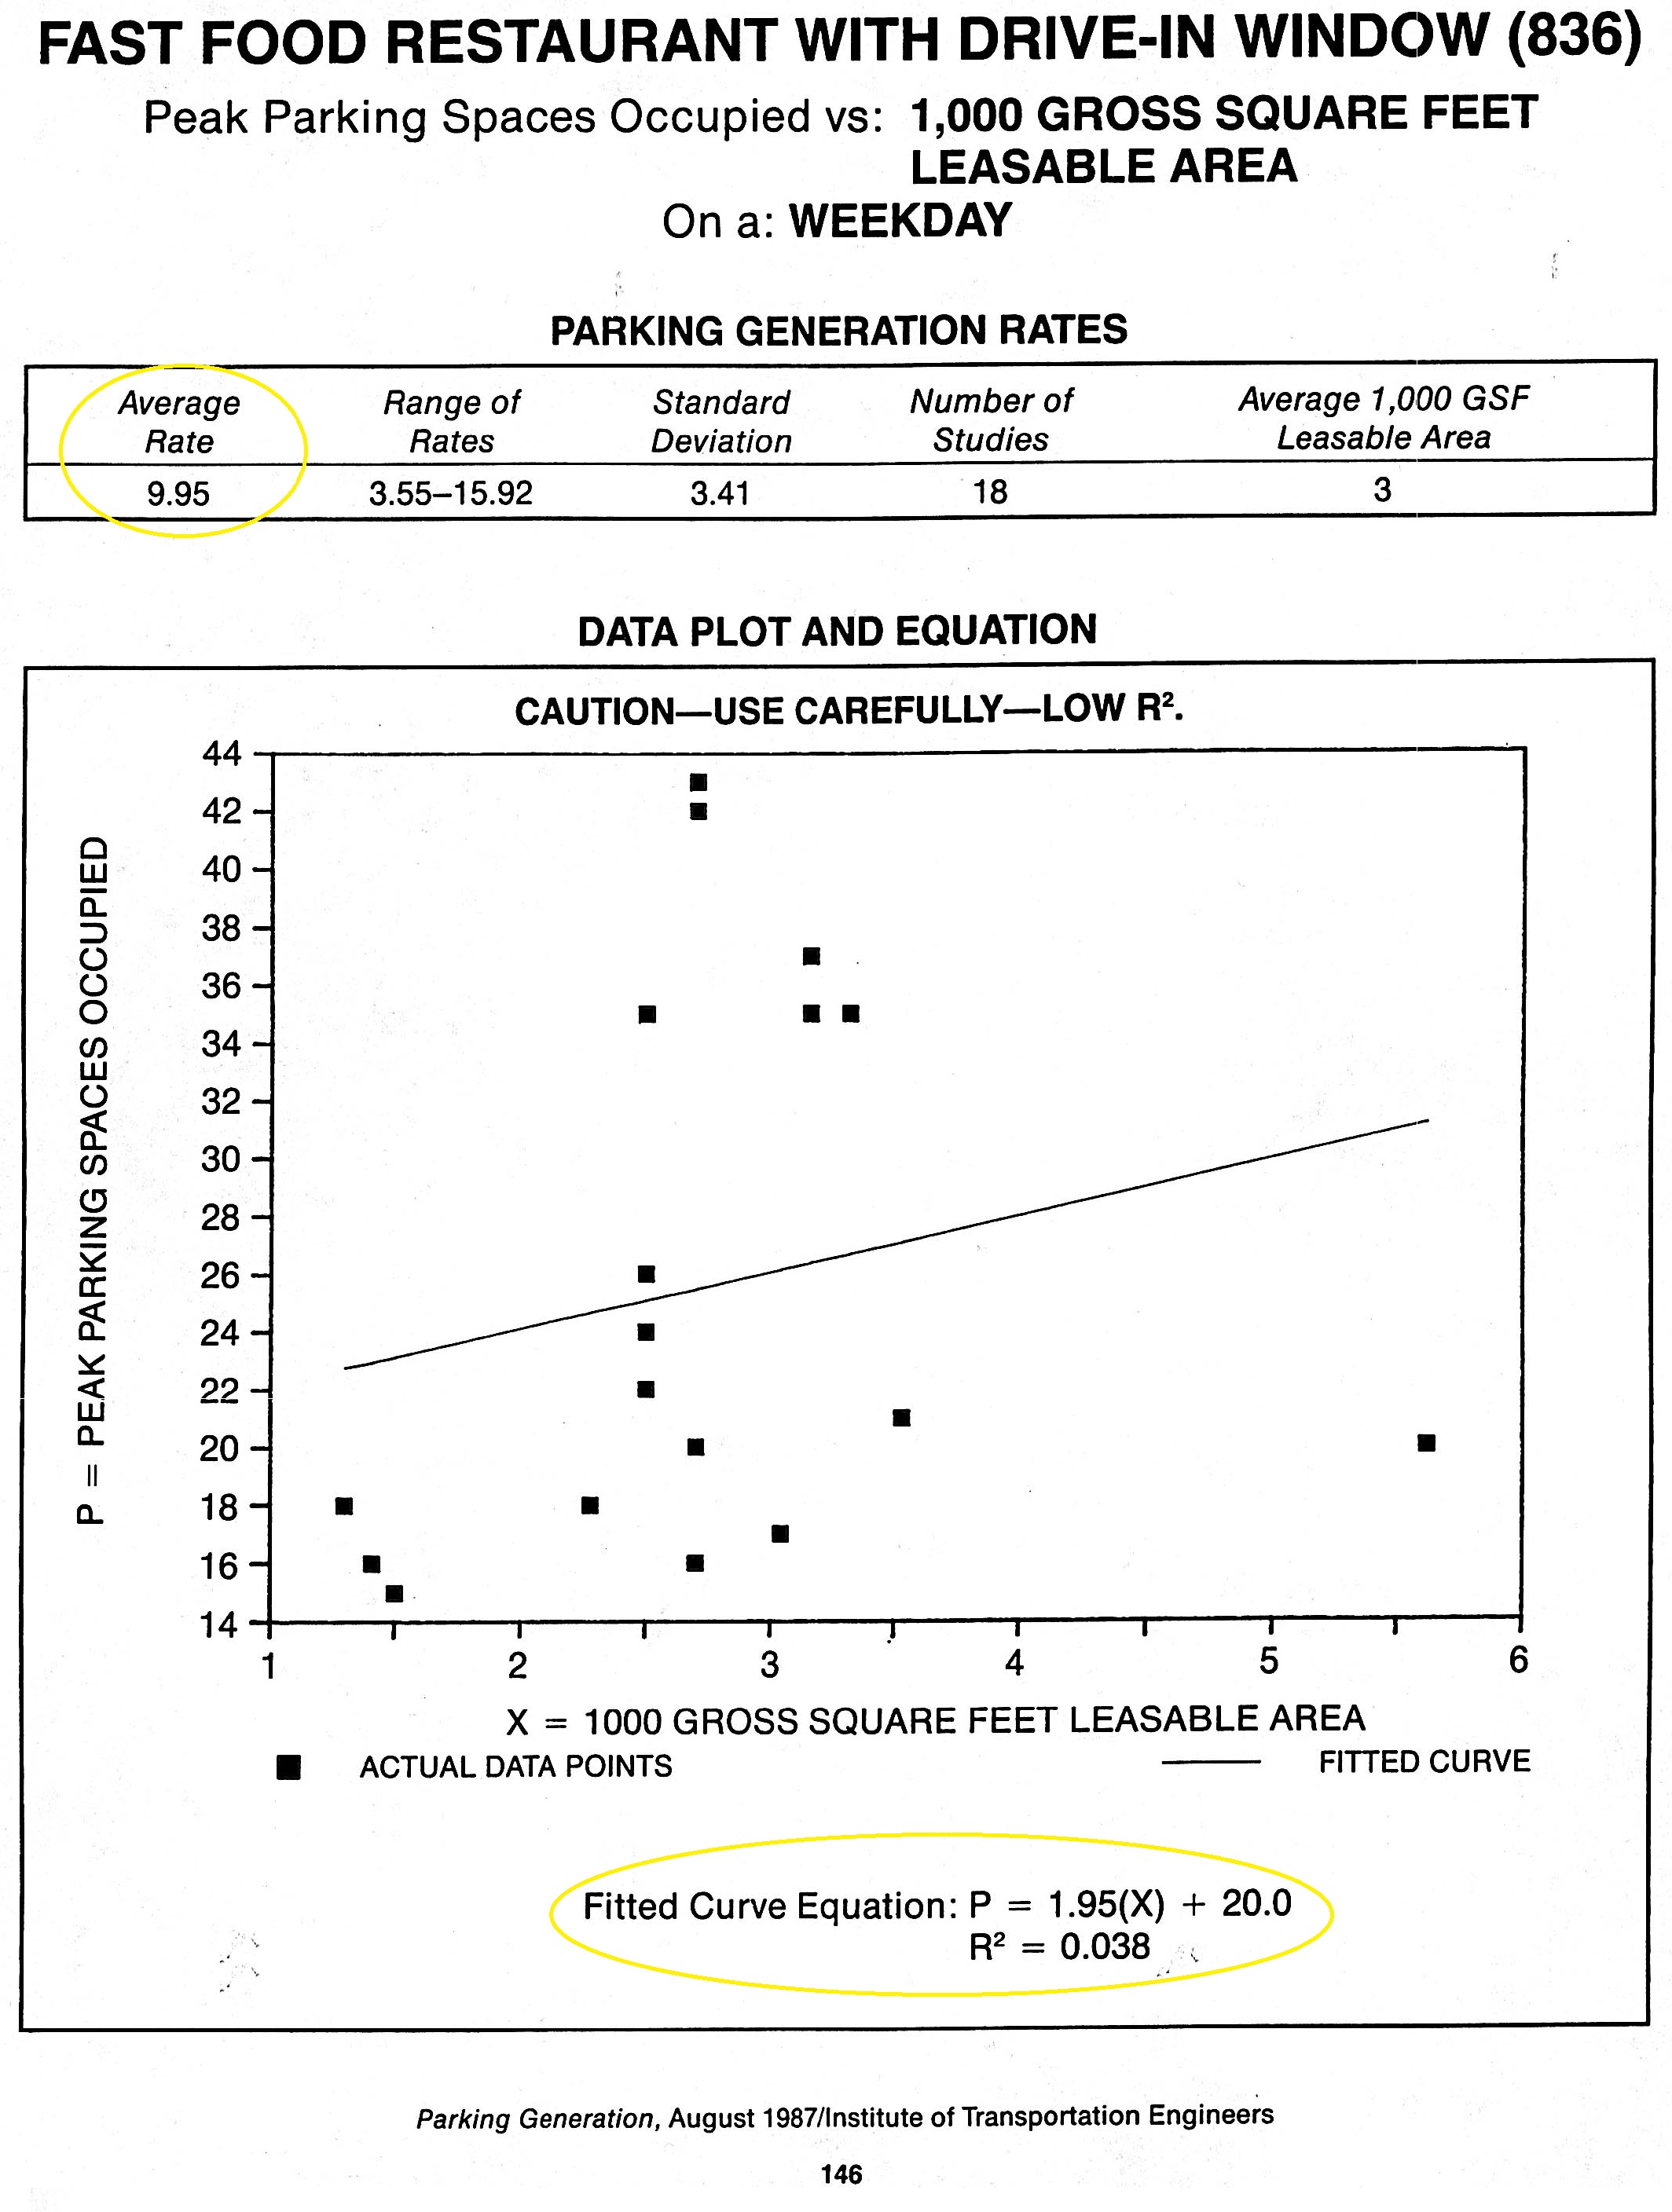 Figure 2 shows the page for fast food restaurants from the most recent edition of Parking Generation (1987). The equation at the bottom of the figure again confirms the visual impression that parking demand is unrelated to floor area in this sample. The largest restaurant generated one of the lowest peak parking occupancies, while a mid-sized restaurant generated the highest. Nevertheless, ITE reports the average parking generation rate for a fast food restaurant as precisely 9.95 parking spaces per 1,000 square feet of floor area.
I do not mean to imply that vehicle trips and parking demand are unrelated to a restaurant’s size. Common sense suggests some correlation. Nevertheless, we should recognize that these two samples do not show a statistically significant relationship between floor area and either vehicle trips or parking demand, and it is misleading to publish precise average rates based on these data.
ITE’s stamp of authority relieves planners from the obligation to think for themselves—the answers are right there in the book. ITE offers a precise number without raising difficult public policy questions, although it does warn, “Users of this report should exercise extreme caution when utilizing data that is based on a small number of studies.” Nevertheless, many planners recommend using the parking generation rates as minimum parking requirements because they are the best data available. For example, the median number of parking spaces required by law for fast food restaurants in the US is 10 spaces per 1,000 square feet—almost identical to ITE’s reported parking generation rate. After all, planners expect minimum parking requirements to meet the peak demand for free parking, and parking generation rates seem to have predicted this demand precisely! When ITE speaks, urban planners listen.
Statistical Significance
This breathtaking combination of extreme precision and statistical insignificance in the parking and trip generation rates at fast food restaurants raises an important question: how many rates for other land uses are statistically significant? Surely some of the rates must be suspect, but they are all reported to three-digit precision.
ITE first stated a policy regarding statistical significance in the fifth edition of Trip Generation (1991):
- Best fit curves are shown in this report only when each of the following three conditions is met:
- The R2 is greater than or equal to 0.25.
- The sample size is greater than or equal to 4.
- The number of trips increases as the size of the independent variable increases.
The third criterion lacks a scientific basis. For example, suppose the R2 is greater than 0.25 (which means that variation in floor area explains more than 25 percent of the variation in vehicle trips), the sample size is greater than 4, and vehicle trips decrease as floor area increases. The first two criteria are met but the third criterion is not. In such a case ITE would report the average trip generation rate (which implies that vehicle trips increase as floor area increases), but not the equation. The stated policy would therefore conceal evidence that contradicts the predicted relationship.
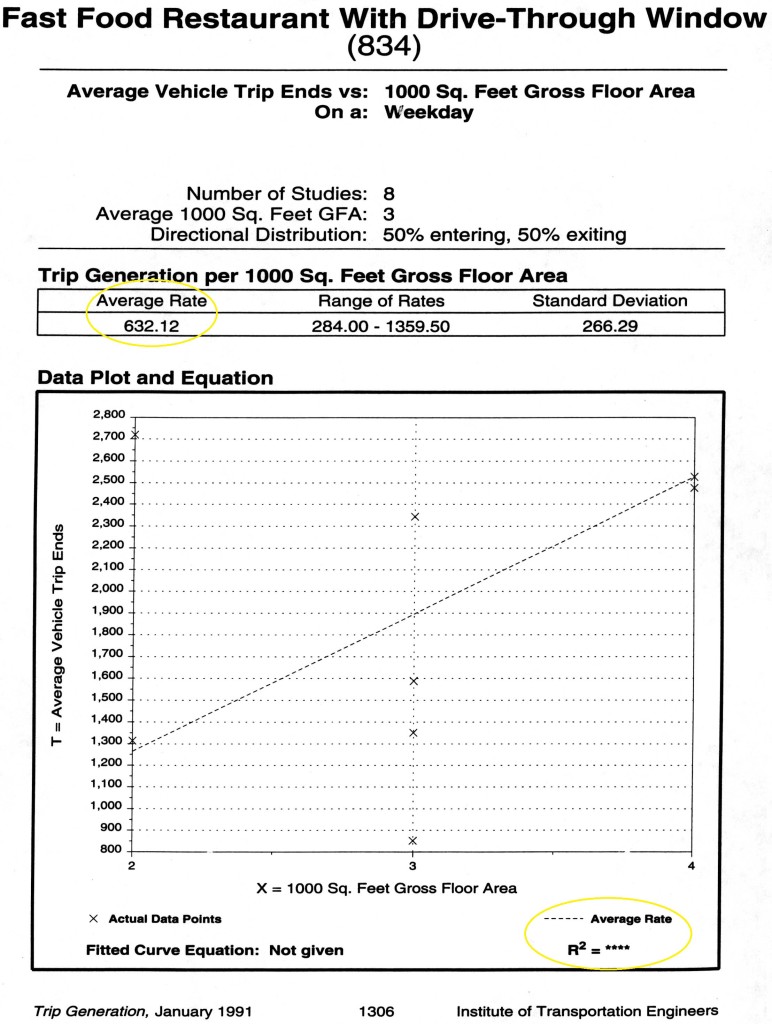
Figure 3, from the fifth edition of Trip Generation (1991), shows how this policy affects the report on fast food restaurants. It shows the same eight data points as the fourth edition, but omits the regression equation, the R2, as well as the warning “Caution—Use Carefully—Low R2.” (The fifth edition is, however, more cautious about needless precision: it truncates the average trip generation rate from 632.125 to 632.12 trips per 1,000 square feet.)
ITE revised its reporting policy in the most recent edition of Trip Generation (1997). Now it shows the regression equation only if the R2 is greater than or equal to 0.5, but the other two criteria remain the same. This edition reports regression equations for only 34 percent of the reported rates, which means 66 percent of the trip generation rates fail to meet at least one of the three criteria.
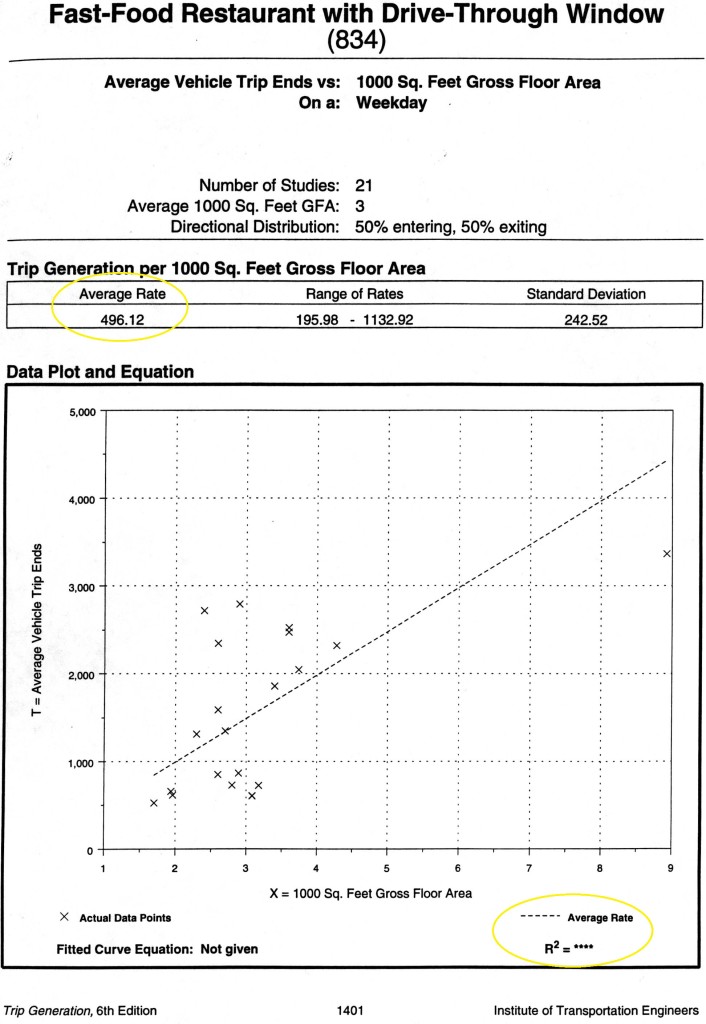
Figure 4 shows the trip generation report for a fast food restaurant from the sixth edition. The number of studies increased to 21, and the average trip generation rate fell to 496.12 trips per 1,000 square feet. Since the fifth edition’s rate was trips per 1,000 square feet, anyone comparing the two editions might conclude that vehicle trips to fast food restaurants declined 22 percent between 1991 and But both the previous rate (632.12) and the new one (496.12) were derived from data showing almost no relation between floor area and vehicle trips, so this decline is uncertain.
Not including the equation is ITE’s subtle way of pointing out that the information is statistically insignificant, but reporting the misleadingly precise averages anyway creates serious problems. Many people rely on ITE manuals to predict how urban development will affect parking and traffic. When estimating traffic impacts, for example, developers and cities often battle fiercely over whether a precise trip generation rate is correct; given the uncertainty involved, the debates are ludicrous. But few seem to pay attention to this; in fact, some cities base zoning categories on ITE’s trip generation rates. Consider the zoning ordinance in Beverly Hills, California:
The intensity of use will not exceed either sixteen (16) vehicle trips per hour or 200 vehicle trips per day for each 1,000 gross square foot of floor area for uses as specified in the most recent edition of the Institute of Traffic Engineers’ publication entitled “Trip Generation.”
The precise but uncertain ITE data thus govern which land uses a city will allow. Once they have been incorporated into municipal codes, parking and trip generation rates are difficult to challenge. Planning is an uncertain activity, but it is difficult to incorporate uncertainty into regulations. Besides, admitting the flimsy basis of zoning decisions would expose them to countless lawsuits.
Planning for Free Parking
Not only are most ITE samples too small to draw statistically significant conclusions, but ITE’s method of collecting data also skews observations to sites with high parking and trip generation rates. Larger samples might solve the problem of statistical insignificance, but a basic problem with these rates would remain: they measure the peak parking demand and the number of vehicle trips at suburban sites with ample free parking.
Consider the process of planning for free parking:
- Transportation engineers survey peak parking demand at suburban sites with ample free parking, and ITE publishes the results in Parking Generation with misleading precision.
- Urban planners consult Parking Generation to set minimum parking The maximum observed parking demand thus becomes the minimum required parking supply.
- Developers provide all the required The ample supply of parking drives the price of most parking to zero, which increases vehicle travel.
- Transportation engineers survey vehicle trips to and from suburban sites with ample free parking, and ITE publishes the results in Trip Generation with misleading precision.
- Transportation planners consult Trip Generation to design the transportation system that brings cars to the free parking.
- Urban planners limit density so that new development with the required free parking will not generate more vehicle trips than nearby roads can This lower density spreads activities farther apart, further increasing vehicle travel and parking demand.
The loop is completed when transportation engineers again survey the peak parking demand at suburban sites that offer free parking and—surprise!—find that more parking is needed. Misusing precise numbers to report uncertain data gives a veneer of rigor to this elaborate but unsystematic practice, and the circular logic explains why planning for transportation and land use has gone subtly, incrementally wrong. Cities require off-street parking without considering parking prices, the cost of parking spaces, or the wider consequences for transportation, land use, the economy, and the environment.
ITE manuals do not cause this circular and cumulative process, and ITE of course deplores any misuse of its parking and trip generation rates. ITE warns users to be careful when the R2 is low, but removed this advice from the data plots in the two most recent editions of Trip Generation. ITE also advises:
At specific sites, the user may want to modify the trip generation rates presented in this document to reflect the presence of public transportation service, ridesharing or other TDM measures, enhanced pedestrian and bicycle trip-making opportunities, or other special characteristics of the site or surrounding area.
Nevertheless, there is no suggestion about how a user might modify the rates, and the price of parking is prominently not on the list of special characteristics that might affect trip generation.
The users of any data should always ask themselves whether the data are appropriate for the intended purpose. Only users can misuse data, but ITE invites such misuse. The spurious precision of ITE’s statistically insignificant estimates has helped establish parking requirements and trip generation rates as dogma in the planning profession.
American motor vehicles alone consume one eighth of the world’s total oil production, and ubiquitous free parking contributes to our automobile dependency. What can be done to improve this situation? Here are four suggestions:
- ITE should report the parking and trip generation rates as ranges, not as precise This puts the information in the most accessible form for potential users who are not statistically trained.
- ITE should show the regression equation and the R2for each parking and trip generation report, and state whether the floor area (or other independent variable) has a statistically significant relation to parking demand or trip rates.
- ITE should state in the report for each parking and trip generation rate that the rate refers only to suburban sites with ample free parking and without transit service, pedestrian amenities, or TDM programs.
- Urban planners should recognize that even if the ITE data were accurate, using them to set parking requirements will contribute to free parking and automobile dependency.
Less Precision and More Truth
Parking and trip generation estimates respond to a real demand for essential information. Citizens want to know how development will affect  parking demand and traffic congestion in their neighborhoods. Developers want to know how many parking spaces they should provide for their employees and customers. Planners want to regulate development to prevent problems with parking and traffic. Politicians want to avoid complaints from unhappy parkers. These are all valid concerns, but false precision does not resolve them. To unsophisticated users, the precise rates look like constants, similar to the boiling point of water or the speed of light. Many planners treat parking and trip generation like physical laws and the reported rates like scientific observations. But parking and trip generation are poorly understood phenomena, and they both depend on the price of parking. Demand is a function of price, not a fixed number, and this does not cease to be true merely because transportation engineers and urban planners ignore it. Most cities are planned on the unstated assumption that parking should be free—no matter how high the cost.
ITE’s parking and trip generation rates illustrate a familiar problem with statistics in transportation planning. Placing unwarranted trust in the accuracy of these precise but uncertain data leads to bad policy choices. Being roughly right is better than being precisely wrong. We need less precision—and more truth—in transportation planning.
Further Reading
Parking Generation. Second Edition. Washington, D.C.: Institute of Transportation Engineers. 1987.
Trip Generation. Fourth Edition. Washington, D.C.: Institute of Transportation Engineers. 1987.
Trip Generation. Fifth Edition. Washington, D.C.: Institute of Transportation Engineers. 1991.
Trip Generation. Sixth Edition. Washington, D.C.: Institute of Transportation Engineers. 1997.
Planning Advisory Service. Off-Street Parking Requirements: A National Review of Standards. Planning Advisory Service Report Number 432. Chicago: American Planning Association. 1991.
Donald Shoup, “Truth in Transportation Planning,” Journal of Transportation and Statistics, 2002.