
Carsharing in North America is changing the transportation landscape of metropolitan regions across the continent. Carsharing systems give members access to an automobile for short-term use. The shared cars are distributed across a network of locations within a metropolitan area. Members can access the vehicles at any time with a reservation and are charged by time or by mile. Carsharing thus provides some of the benefits of personal automobility without the costs of owning a private vehicle.
Carsharing has grown to more than 20 major metropolitan regions throughout the US and Canada. As of January 2011, North American carsharing companies served almost 604,000 members with about 10,000 vehicles.
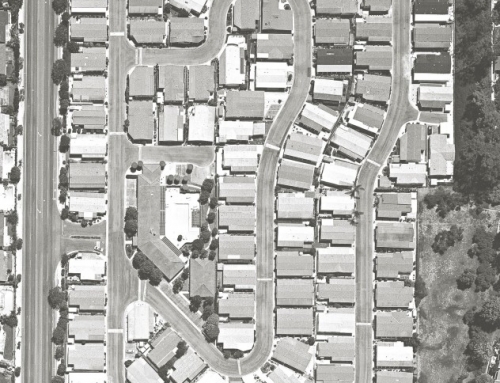
 Carsharing can reduce household vehicle ownership because the service can eliminate the need for a private vehicle to complete non-work trips. In this way, carsharing provides members with an automobile only when needed. Typically, several members throughout the day access a shared vehicle. Vehicles are most frequently parked in dense urban areas with good public transportation services. The shared vehicles eliminate upfront ownership costs, but members still maintain auto access while leading a less car-dependent lifestyle.
Advocates for carsharing have frequently argued that the service not only reduces vehicle ownership, but also improves fuel efficiency, because carshare vehicles tend to be more fuel efficient than the average vehicle. While sensible, to date these claims have been hard to evaluate because data have been difficult to acquire. We conducted a survey to evaluate these claims and found strong evidence to support them.
Measuring the Scope and Impact of Carsharing
![]() In late 2008, we conducted an online survey of North American carsharing members. The survey reached members of the carsharing industry’s leading organizations: AutoShare, City CarShare, CityWheels, Community Car Share of Bellingham, CommunAuto, Community Car, Co-operative Auto Network, IGo, PhillyCarShare, VrtuCar, and Zipcar.
In late 2008, we conducted an online survey of North American carsharing members. The survey reached members of the carsharing industry’s leading organizations: AutoShare, City CarShare, CityWheels, Community Car Share of Bellingham, CommunAuto, Community Car, Co-operative Auto Network, IGo, PhillyCarShare, VrtuCar, and Zipcar.
We asked respondents about their household’s travel behavior during the year before they joined carsharing, and about their travel behavior “at present.” We also asked how many vehicles the household owned before joining carsharing and at the time of the survey. We asked about households, rather than individuals, because carsharing can affect the travel patterns of multiple people in the same household, even if only one person in the household is a carshare member. For example, a married couple may commute to jobs in separate locations, both by automobile. The husband then joins carsharing and starts to commute by public transit, but the couple keeps “his” car because it is newer. They shed the wife’s vehicle and she uses the remaining car for her commute once they become a one-car household. In this case, surveying at the individual level might wrongly suggest that carsharing had not resulted in a vehicle reduction. Surveying at the household level helps avoid this problem.
![]() We also collected data on the make, model, and year of each vehicle within the household both before joining carsharing and at the time of the survey. This information was used to determine the vehicle’s fuel economy by linking each vehicle to an appropriate entry in the Environmental Protection Agency (EPA) fuel economy database, which contains information on cars built since 1978. In addition, we asked questions about the make and model of the carsharing vehicle that members drove most often and whether they would have purchased a car in the absence of carsharing.
We also collected data on the make, model, and year of each vehicle within the household both before joining carsharing and at the time of the survey. This information was used to determine the vehicle’s fuel economy by linking each vehicle to an appropriate entry in the Environmental Protection Agency (EPA) fuel economy database, which contains information on cars built since 1978. In addition, we asked questions about the make and model of the carsharing vehicle that members drove most often and whether they would have purchased a car in the absence of carsharing.
 In the end, we had responses from 6,281 households in carsharing organizations that use the “neighborhood” business model. The neighborhood business model consists of carsharing vehicles positioned in residential and mixed-use neighborhoods for use by local residents, and represents about 90 percent of the industry’s membership base. Two business models we did not consider in this analysis were the college and corporate business models, which represent smaller and distinct markets within the industry.
Vehicles Shed as a Result of Carsharing
 We found that carsharing lowers the total number of vehicles owned by members. Across the sample, households owned 2,968 vehicles before carsharing, which translates to 0.47 vehicles per household. After carsharing, the sample owned 1,507 vehicles, or 0.24 vehicles per household. The difference between these means (–0.23) is statistically significant at the 99 percent confidence level. Notably, much of this shift involved households becoming carless: 80 percent of the sample owned no vehicle after joining carsharing. Most of this shift was the result of one-car households becoming no-car households. A smaller change occurred with two-car households becoming one-car households.
Carsharing not only reduces the number of personal vehicles owned across the sample; it can also deter carless households from acquiring a vehicle. Most of the households that join carsharing are carless: 62 percent of households joining carsharing owned no vehicle when they joined, while 31 percent of households owned one vehicle. That is, some carsharing members who consider buying a car ultimately decide against it and use carsharing instead. This effect is hard to measure because a decision not to purchase something is hard to observe. However, in the survey we asked respondents whether in the absence of carsharing they would buy a car. The available responses included “definitely not,” “probably not,” “maybe,” “probably,” and “definitely.” This question gives insight into the degree to which carsharing substituted for a personal vehicle that would have been purchased. About 25 percent of the total sample indicated that they “maybe,” “probably,” or “definitely” would buy a car in the absence of carsharing.
 Fuel Economy and Age of Vehicles Added and Shed

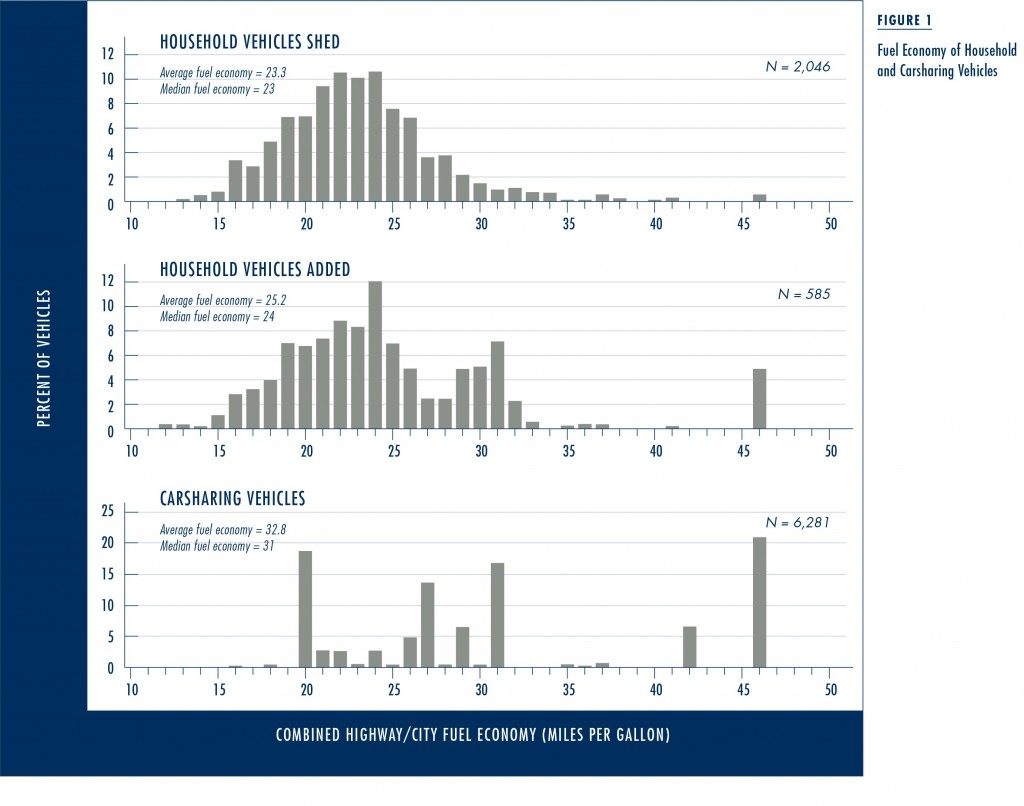
Figure 1 shows the distribution of the fuel economy of vehicles shed, added, and used by carsharing households. The average fuel economy of vehicles shed is 23 mpg and the fuel economy of vehicles added has a slightly higher average of 25 mpg. The average fuel economy of carsharing vehicles is much higher, at 33 mpg. Hence, the average carsharing vehicle is about 10 mpg more efficient than the average vehicle shed by members. While carsharing organizations offer a variety of vehicle types to members, the majority are highly efficient hybrids, sedans, and compact cars.
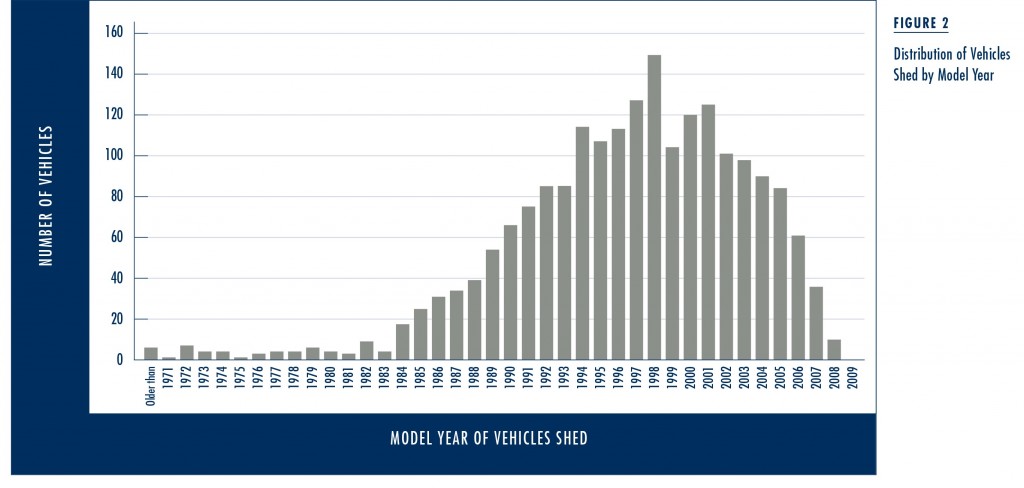
The age of the vehicles that people shed after joining carsharing varies considerably. About 60 percent of the vehicles shed by the sample are between 5 and 15 years old, which falls within a typical vehicle life. Nearly 15 percent are newer than 5 years, while the remaining 25 percent are older than 15 years. The diversity of vehicles shed is evident in Figure 2, which shows the distribution of all shed vehicles by model year.
 These results show that carsharing members reduce their ownership of older vehicles and shift their driving towards newer, more efficient vehicles. However, these results do not quantify the trade-off between personal vehicles shed and the new vehicles added to the road by carsharing organizations. What is the net effect of this trade-off?
 To evaluate this question, we need to understand the population represented by this sample. As mentioned earlier, the sample covers the neighborhood business model of the carsharing industry, which is by far the largest. In addition, some households have two carsharing members, and since the impact is expressed in household units and not members, the population of households is smaller than the population of members. Finally, some carsharing members are inactive in their membership (i.e., they do not use carsharing very frequently). Such members can exist within plans that permit membership at little or no cost, and they represent about 10 percent of our sample. In our study, we considered the impact of inactive members to be zero; we do not ascribe their observed changes in vehicle ownership to carsharing because they rarely use the service. When considering these factors, we estimate that the population represented by this sample consisted of between 189,000 and 267,000 households actively using carsharing. Given the roughly 9,800 vehicles deployed by the organizations at the time of the survey, we estimate that approximately four to six vehicles were shed for every carsharing vehicle. The shed vehicles do not include vehicles that were not purchased due to carsharing. When we consider the vehicles potentially not purchased (as defined earlier) in addition to those shed, we estimate that every carsharing vehicle removes between 9 and 13 other vehicles from the road.
Conclusion
Carsharing can substantially reduce the number of vehicles owned by member households, despite the fact that 60 percent of all households joining carsharing are carless. Households joining carsharing owned an average of 0.47 vehicles per household before joining carsharing, but that average dropped to 0.24 after membership. Carshare households exhibited a dramatic shift towards a carless lifestyle. The vehicles shed are often older, and the carsharing fleet is an average of 10 mpg more efficient than the vehicles shed.
Households joining carsharing owned an average of 0.47 vehicles per household before joining carsharing, but that average dropped to 0.24 after membership.
 Given North America’s shifting demographics, urban environments, and industry dynamics, additional research on the impacts of carsharing is warranted. As carsharing continues to grow, its impact may expand. Carsharing represents an attractive alternative for carless households, but such households are a minority in North America at present. In the future, as carsharing networks grow and become more established, their attractiveness to vehicle-owning households may increase. Further, carsharing may expand into lower-density communities, such as the suburbs, through peer-to-peer carsharing (carsharing in which the vehicle fleet is member-owned through the use of personal vehicles as part-time carsharing vehicles). Thus, while this study shows that carsharing has already had a significant and measurable impact in many metropolitan regions, industry growth into new markets may produce much greater environmental benefits in the future.
Acknowledgments
The Mineta Transportation Institute, California Department of Transportation, and Honda Motor Company, through its endowment for new mobility studies at the University of California, Davis, generously funded this research. We also thank the carsharing organizations that participated in the survey.
Further Readings
Robert Cervero, Aaron Golub, and Brendan Nee. 2007. “City Carshare: Longer-Term Travel
Demand and Car Ownership Impacts,” Transportation Research Record: Journal of the Transportation Research Board, 1992: 70–80.
Clayton Lane. 2005. “PhillyCarShare: First-Year Social and Mobility Impacts of Carsharing in Philadelphia, Pennsylvania,” Transportation Research Record: Journal of the Transportation Research Board, 1927: 158–166.
Elliot Martin and Susan Shaheen. 2010. “Greenhouse Gas Emission Impacts of Carsharing in North America,” Mineta Transportation Institute, San Jose State University.
Elliot Martin, Susan Shaheen, and Jeffrey Lidicker. 2010. “Impact of Carsharing on Household Vehicle Holdings: Results from a North American Shared-Use Vehicle Survey,” Transportation Research Record: Journal of the Transportation Research Board, 2143: 150–158.
Susan Shaheen, Adam Cohen, and Melissa Chung. 2009. “Carsharing in North America: A Ten-Year Retrospective,” Transportation Research Record: Journal of the Transportation Research Board, 2110: 35–44.
[/fusion_text]
