Imagine that it’s January 1993. Our environmentalist coalition has swept all the national elections and is ready to declare war on the automobile. We shall make urban life in America as civilized as urban life in Europe. Our major legislative program is put forth, and passed:
- We triple the price of gasoline – to $4 per gallon.
- We build thousands of miles of rail transit.
- We radically increase the cost of downtown parking.
- We effectively restrict land use so that most of the suburban population moves back into the cities.
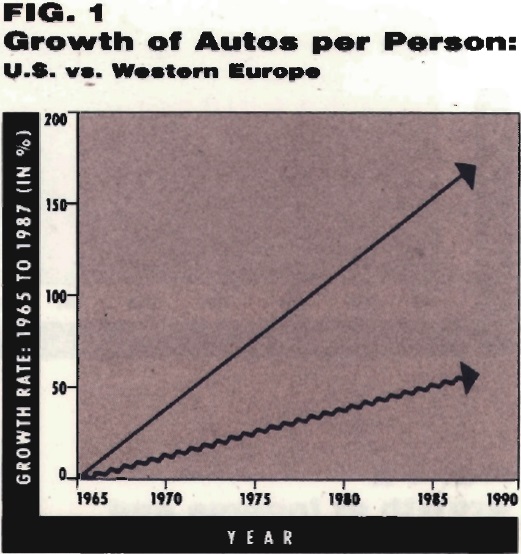
Tough measures? Yes, but worth it. We are serious about driving a stake through the heart of the automobile demon. To validate the efficacy of these new policies all we need to do is look abroad. Most Western European nations implemented such legislation years ago. Let’s look at their success. Figure 1 compares the growth of the automobile population in the U.S. and in Western Europe.
Notice, over the period 1965-87, the 3-to-1 ratio in the growth of automobiles per capita. An impressive difference. And how much of that difference can we attribute to the pro-transit, anti-auto, anti-suburbanization policies in Western Europe? Unfortunately, at least in terms of this graph, the answer is: None. The fast growth curve in Figure 1 is Western Europe; the slow growth curve is the United States.
There are no statistical gimmicks in Figure 1; the number of automobiles in Western Europe has risen about three times as fast as the number in this country. To understand why, consider a very simple explanation.
First of all, people have a strong desire for convenient, fast, private transportation. As personal income rises, people are increasingly able to afford these desires. Most people seem to view public transportation as a barely tolerable substitute for the real things – their own cars. But they will quickly buy cars once they have enough money to do so. The tough anti-auto policies in Western Europe have been overwhelmed by a far stronger force: the growth of personal income. Let’s begin by examining data from the United States.
DEMOGRAPHICS OF AUTO GROWTH IN THE UNITED STATES
From 1950 to 1970, the number of vehicles in the United States grew 3.8 times faster than the human population. One reason for the disproportionate growth rate was the country’s changing age structure: the large baby boom cohort got older and began to get driver’s licenses. Although the total U.S. population grew slowly, the portion eligible to drive grew quite rapidly. But now the transition in age structure is over. The baby boom ended in 1964; the youngest are now 28 years old. The number or new driving-age Americans is not what it once was.
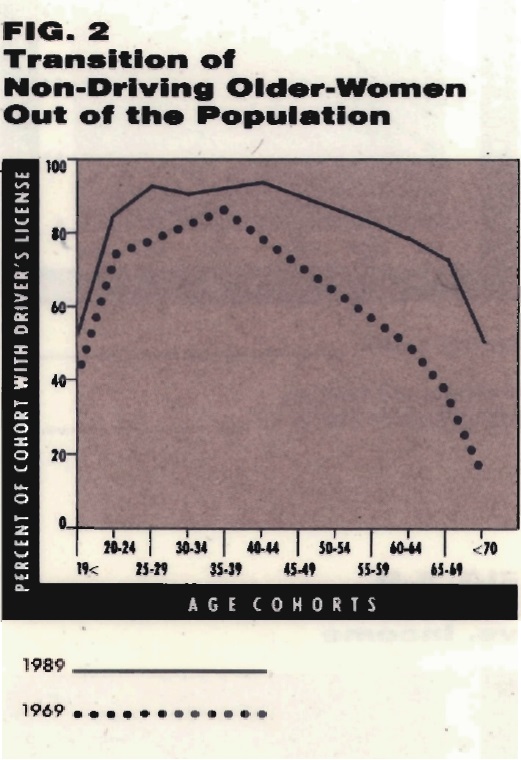
Traditional sex roles related to driving and working have also changed, and so the numbers of women with driver’s licenses grew much faster than the population as a whole. Figure 2 shows the pattern or licensing among women in 1969 and 1989. The 1969 data show a sharp decline in the proportion of women driving after age 40: these older women grew up in a time when it was not customary for women to drive. But this drop-off is not evident in the 1989 data. To see this more clearly, mentally shift the 1969 curve to the right 20 years, add in a small secular increase and the result is close to the observed 1989 data. The essentially flat profile in 1989 shows that this demographic transition is almost completed.
One of the forces behind the change in licensing patterns was overall income growth. Also important was the growth in women’s participation in the job market. Jobs increase financial clout and let a higher proportion of women demand the kind of independence that auto travel provides. The number or women working in the United States has risen steadily, and by 1988, 56.6 percent of all working-age women were in the labor force. Can it rise much higher? The 56.6 percent figure seems to allow plenty of room.
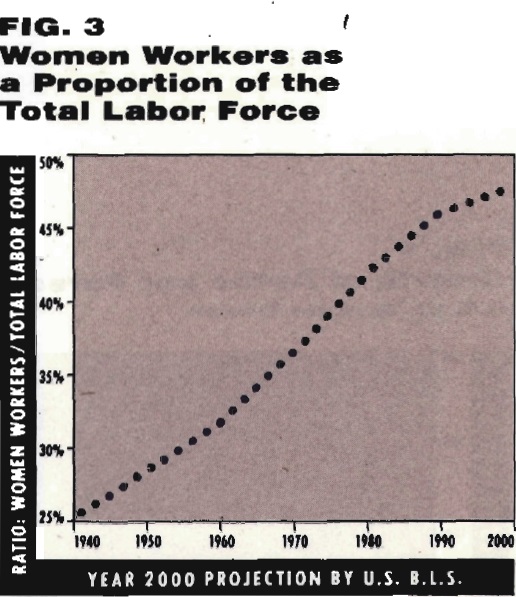
It doesn’t work that way, however. We should not expect that all women will ultimately choose to compete in the job market, especially since we know that all working-age men don’t. Using labor force figures as a baseline, Figure 3 shows the relevant ratio and its growth over time. Women’s labor force participation is now 82 percent of men’s, and it is obvious that the growth is slowing. In fact, the Bureau of Labor Statistics projects only 5 percent growth during the 1990s.1
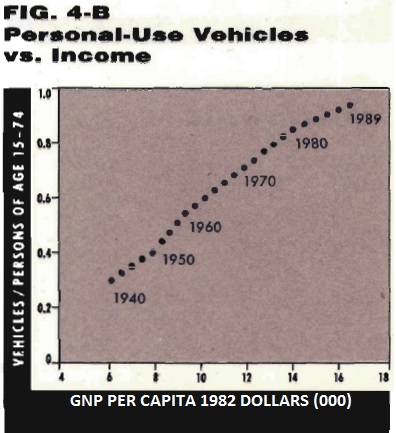
Research also suggests a strong relationship between income and vehicle ownership. So it seems reasonable to suspect that the enormous growth in U.S. per capita income during the 1950-70 period led to an equally explosive growth in numbers or vehicles. Figure 4-A shows the data: the top line shows growth in income per person; the lower line shows growth in vehicles per person.2 Figure 4-B plots the relationship between these ratios. The horizontal axis is per capita income in constant 1982 dollars. The curve starts at about 0.3 vehicles per person in 1940 and grows to almost one vehicle per person today.
SATURATION OF AUTO DEMAND
Casual observers attribute the increase in the number of automobiles to population growth (more people means more cars), while more sophisticated observers know that income and licensing are important factors. But what many have missed altogether is the slowdown in growth resulting from saturation of auto demand. The shifts in demographics that produced the increases have run their course. The growth in vehicle population will be much slower in the future.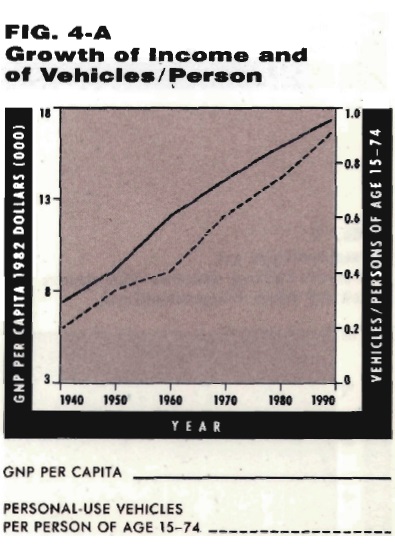
Trends in auto sales can be understood through comparison to the videocassette recorder (VCR) market. When VCRs were first introduced, no households had them. As consumers began buying VCRs, yearly sales rose much faster than the annual population growth. But manufacturers eventually reached a saturation point: nearly every household had a VCR. Since few consumers felt they needed more than one, VCR growth rates declined. Future sales will primarily be to first-time buyers, or to replace existing recorders. (This analogy also explains the over-capacity in auto manufacturing, and suggests that the current round of plant closings will be permanent, not temporary.)
We now have about 1.1 vehicles per licensed driver, but this is not a good measure of saturation. This ratio has always been high (it was .8 vehicles per licensed driver in 1950). To measure vehicle saturation, we must look at the ratio of cars to potential drivers – that is, all persons of driving age. The United States had .95 vehicles per person of driving age in 1989; essentially one car per person capable of being licensed. Absent distribution effects, such a ratio seems a good indication of vehicle saturation.
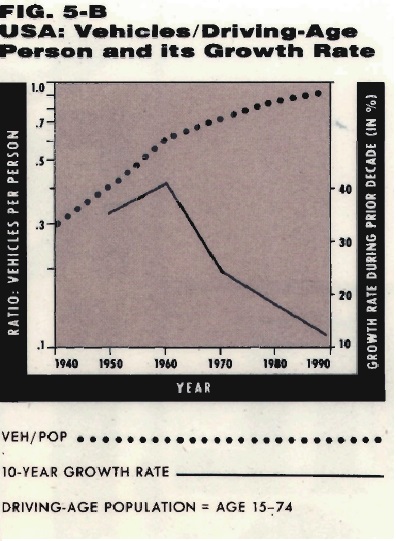
Figure 5-A shows the disproportionate growth rate of vehicles compared to the driving-age population. Figure 5-B shows the same data in a different perspective: the growth of vehicles per person. In the 1950s, the ratio of vehicles to people jumped 40 percent, followed by a 27 percent jump in the 1960s, a 19 percent rise in the 1970s, and only a 12 percent increase during the 1989s. The era of disproportionate vehicle growth is over.
DISTRIBUTIONAL ISSUES
Does this country’s average of 0.95 vehicles per person of driving age indicate vehicle saturation? What might be hiding behind this average?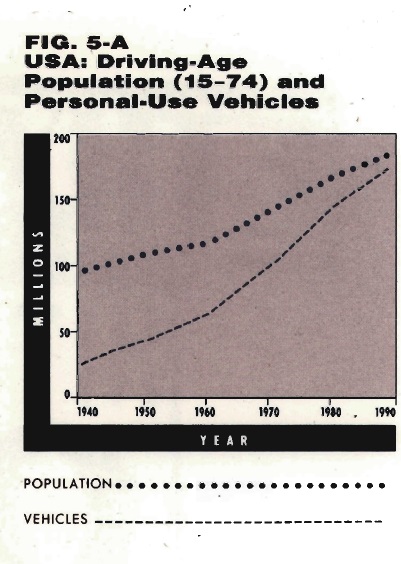
Regional Effect: Perhaps the high average reflects a few “car crazy” states (like California) being combined with more environmentally conscious states. I compiled data for 13 states distributed randomly across the United States. All regions show essentially similar patterns of vehicle growth and saturation. (Nor is California abnormal: in the West, Colorado and Washington have significantly higher vehicle/population ratios; Florida and Georgia are higher in the South.)
Household Effect: Perhaps the high statewide averages conceal big differences among households: some households have many more vehicles than drivers, while others have none. I cannot make a direct evaluation of this possibility with the available published data. I can, however, show that the unequal distribution effect is not large. In 1980, 82-90 percent of all households had at least as many vehicles as workers.
Researcher Alan Pisarski comments: “Zero-vehicle households tend to be very small households located in larger central cities. In fact, the New York area alone has 20 percent of the nation’s households having no vehicles.”3 Accordingly, I do not expect any additional vehicle growth to come from purchases made by members of zero-vehicle households.
SUMMARY FOR THE UNITED STATES
The United States has undergone a period or disproportionately rapid growth in numbers of autos. The increased desire for auto transportation was sparked by changes in the composition of the work force, and in the age structure of the population. The increase in per capita income gave people the means to implement their desires.
These changes have run their course. Although the era of rapid growth is over, its psychological effects are not. Much of our pessimism about congestion comes from living during that rapid growth period. Planners say there’s no point in building more roads, they always fill up immediately. But sometimes we place too much weight on experience. Generals prepare to fight the last war; urban planners prepare to fight the last trend. It’s time to think seriously about expanding the U.S. highway network.
AUTO GROWTH AND USE IN WESTERN EUROPE
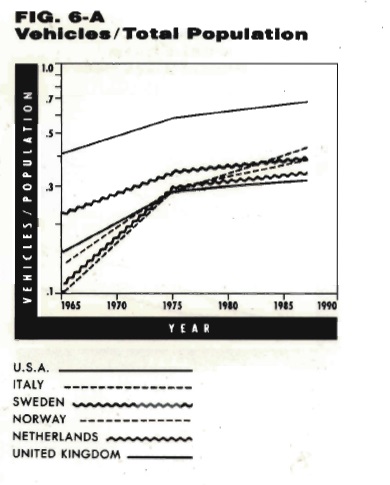 Figures 6-A and 6-B show the curves of vehicle growth In 10 Western European countries. The difference in growth rates between the United States and Europe is clear: the United States has reached the saturation point while Europe is still growing fast.
I noted earlier that even Europe’s tough anti-auto policies have not been sufficient to stifle growth in numbers of autos. But where will it end? At current growth rates, these 10 countries will reach the vehicle saturation point in 19 years. Will they get that far? Perhaps those anti-auto policies will stop growth before that point. Perhaps not. Vehicle growth has already increased much further than planners expected.
Vehicle ownership is just part of the story. Intensity of use matters as well. Europe’s high gasoline prices, expensive parking, and inadequate roads must surely discourage driving. But not by much, apparently. In 1987 the average European car was driven 8,149 miles per year, compared with 9,928 in the United States.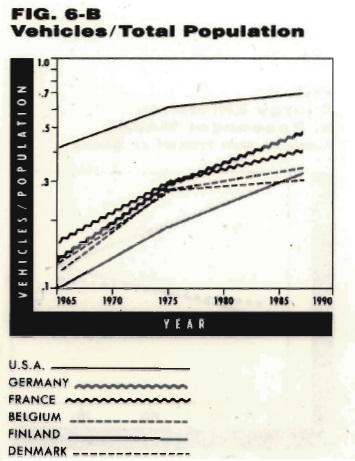 Finally, we might compare growth trends in auto travel. For the period 1965-87, vehicle miles traveled (VMT) per person increased 154 percent in Europe, but only 69 percent in the United States. Consider again Europe’s anti-auto regulations. They include every item that has been on this country’s environmental wish list for the past 30 years. These are strong policies. The degree of governmental restriction upon personal freedom would be unprecedented in this country. But even this set of policies has not been sufficient to exorcise the demons or auto use in Europe.
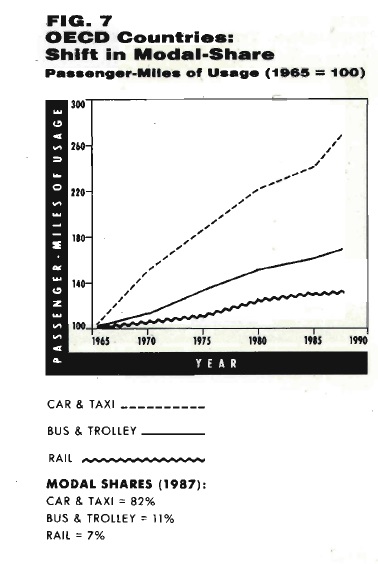
We know that public transportation has lost the battle against the auto in the United States. Figure 7 shows it is losing the battle In Europe too. The fraction of total travel made on public transit is steadily declining. Surely, this is discouraging, for the quality of European transit systems is far better than anything we might hope to achieve In the United States.
ENVIRONMENTAL IMPACT OF PUBLIC TRANSIT
But, suppose we could reverse the trend. Might increased use of public transit then have an important effect on our consumption or energy or on emissions of greenhouse gases? The answer is: no.
 The difference in energy efficiency between transit and autos was never very large to begin with, and federal policy over the past twenty years has reduced it. First, federal CAFE standards have almost doubled auto fuel efficiency since 1973. Second, as an unintended consequence of federal actions to increase transit patronage, the average transit vehicle’s energy efficiency has fallen by about 60%. (Buses and rail transit cars became air conditioned and heavier.) Figure 8 shows the surprising result. Autos, transit buses, and rail transit are now nearly equivalent.
However, we must read these data with caution, for they reflect vehicles operating with average load factors. Autos used for the journey to work have lower than average load factors, so auto energy efficiency would be decreased about 60% for that portion of auto travel. (Commute trips are about 30% of total auto miles of travel.) But the rail data record the average between energy-efficient old rail systems such as the New York subways, and inefficient rail systems such as BART and Washington Metro.
PROSPECTS FOR INCREASING TRANSIT PATRONAGE
Since 1964 the federal mass transit agency has spent about $100 billion trying to find some way to lure people out of cars. Money was easily available to pay for almost any conceivable experiment: subsidized fares (even free fares), more comfortable vehicles, increased schedule frequency, express schedules, free refreshments, timed transfer systems, extended operating hours, special fares for special groups, free parking at transit stations, advertising, image-improvement campaigns, etc. None of these experiments produced significant gains in transit patronage. The federal money managed to halt the long-term decline in patronage, but could not reverse it.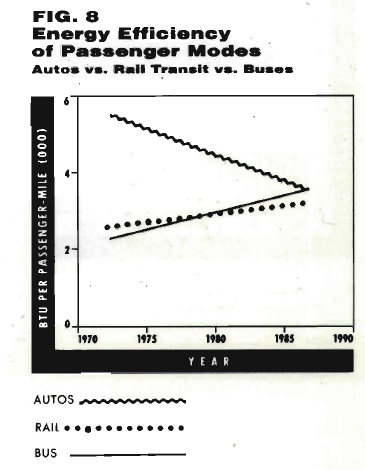
Radical new policy measures such as substantial parking fees would increase transit use for the tiny proportion or travel involved in commuting to large central business districts. But the effect on overall travel volumes would be barely measurable.
So we must conclude that it’s very, very hard LO lure people out of automobiles and into transit. Even if it were possible (and there is no evidence in the literature to support this hope), we would still not save much energy because the energy efficiency of transit and autos are roughly the same.
SUMMARY AND CONCLUSION
In worldwide perspective, rapid growth of automobiles began in the United States because we were richer than other nations. But other nations soon headed down the same path as their incomes increased, and their stock of autos is rapidly approaching ours. Europe’s anti-auto policies may ultimately stop the growth of auto use before it reaches U.S. levels, but that is only a guess.
The desire for personal mobility seems to be unstoppable – it is, perhaps, the Irresistible Force. The role for U.S. policy is clear: if we cannot suppress that desire we should certainly channel it toward a more civilized automobile – one that is smaller, more fuel-efficient, and less polluting. Instead of continuing our ineffective crusade against auto use, we should try to provide environmentally sound automobiles. It’s not so noble a goal as suppression, but it does have the advantage of feasibility.
1Fullerton, p.4
2Throughout this section, the term “vehicles” or “autos” refers to personal-use vehicles, i.e., the sum of cars plus those light trucks used for personal transportation. (This was 67 percent of light trucks in 1987 and 57% in 1982.) The term “population” means the driving-age population, those in the 15-74 age-cohort – the relevant group for measuring demand saturation.
3Pisarki, pp. 6-7
REFERENCES
S. Davis and P. Hu, Transportation Energy Data Book: Edition 11. (Oak Ridge, Tennessee: Oak Ridge National Laboratory for the U.S. Department of Energy, January 1991).
Federal Highway Administration, America’s Challenge for Highway Transportation in the 21st Century, Interim report of the Future National Highway Program Task Force. (Washington, D.C.: U.S. Department of Transportation, November 1988).
Federal Highway Administration, “The Future National Highway Program: 1991 and Beyond.” Working Paper No. 2. “Trends and Forecasts of Highway Passenger Travel,” (Washington, D.C.: U.S. Department of Transportation, December 1987).
Howard N. Fullerton, Jr., “New Labor Force Projections, Spanning 1988-2000,” Monthly Labor Review, Vol.112, No.11, pp3-12, (Washington, D.C.: November 1989).
Steven D. McLaughlin et al, The Changing Lives of American Women, (Chapel Hill: The University of North Carolina Press, 1988).
Gary Maring, Highway Travel Forecasts, (Washington, D.C.: Office of Highway Planning, FHWA, U.S. Department of Transportation, November 1974).
Alan E. Pisarski, Commuting in America: A National Report on Commuting Patterns and Trends, (Westport, Conn.: The Eno Foundation for Transportation, Inc., 1987).
Alan E. Pisarski, “The External Environment for Public Transit to the Year 2020: A Speculative Assessment.” Unpublished paper prepared for the APTA 2000 Task Force. (Washington, D.C.: January 1988).
J.C. Tanner, “International Comparisons of Cars and Car Usage,” TRRL Report LR1070. (Crowthorne, Berkshire: Department of Transport, Transport and Road Research Laboratory, 1983).
U.S. Department of Transportation, Survey Data Tabulations, 1983-84 Nationwide Personal Transportation Study, (Washington, D.C.: November 1985).
U.S. Department of Transportation, Personal Travel in the U.S., 1983-84 Nationwide Personal Transportation Study, Volume I and II, (Washington, D.C.: November 1986).