You’re driving along the freeway when suddenly everything slows down. A crash? A sudden overload of cars joining the freeway from on-ramps up ahead? Maybe. Sometimes the cause never reveals itself to you—inexplicably, everything just starts moving again. If this happens every day in the same spot, you may develop a theory or two as to why it happens. Would it occur to you that the congestion might be caused not by too many cars getting on the freeway but by too many cars trying to get off?
For decades, traffic engineers have been managing freeway congestion by using meters to restrict the rates that vehicles enter the freeway from on-ramps. A metering scheme can often keep cars moving faster on the freeway, and sometimes can even reduce traveler delay systemwide. Realizing these benefits requires metering that is suitably designed, but traffic engineers disagree about what constitutes a suitably designed plan.
The Merge Bottleneck
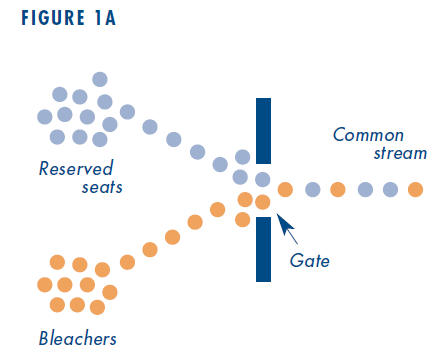 We all know what a bottleneck is on a freeway. We suspect traffic slows down because too many cars are trying to merge, or a lane disappears, or there’s some similar shortage of space. A similar thing can happen when people leave a sports stadium. If a lot of fans stay until the end of the game (say it’s the World Series and the score is tied until the bottom of the ninth), then when they leave there will be pedestrian bottlenecks at the exit gates. Say people coming from the bleachers and people coming from the reserve seats all go out through the same gate. Figure 1A illustrates what happens: more pedestrians arrive from the bleachers and the reserved seats than the gate can handle. The two paths meet, and the short stretch of the common stream before the gate soon piles up in a queue. Fans slow down as they pass through the gate, and queues propagate backwards on both paths. This is a merge bottleneck.
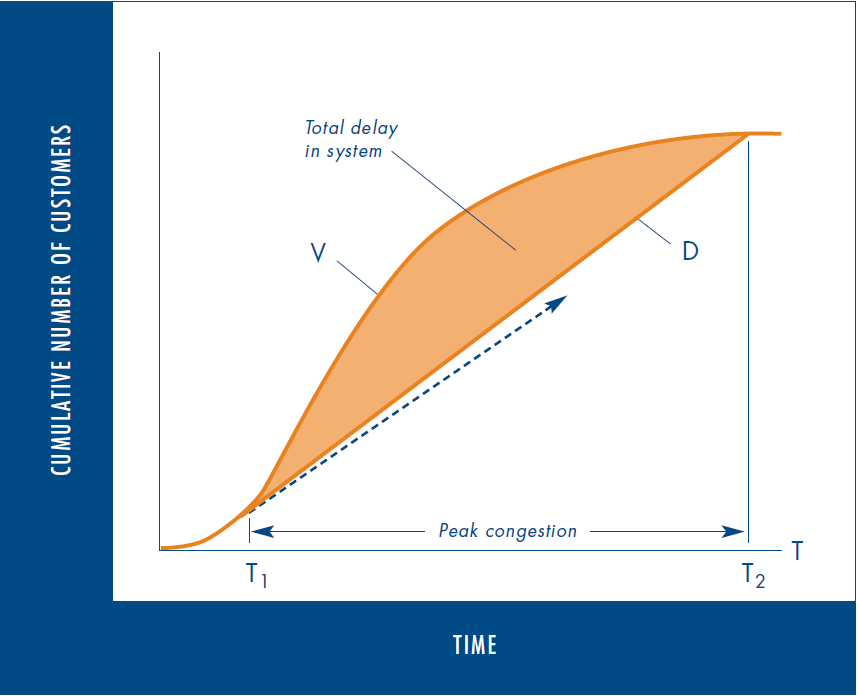
The resulting delay can be displayed on a standard queuing diagram like the one in Figure 2. The top curve, labeled “V” (for virtual departures), depicts the cumulative number of fans from both the bleachers and reserved seats that would like to have left the stadium by any time “T”. It shows the number of people that would have gone through the gate by any particular time if there were nothing to slow them down.
One could construct this curve by measuring, for each path, all individual arrival times at some specified location before the queue—say, at the hot dog stand—adding the amount of time it would take each individual to reach the gate from the hot dog stand if there were no one in the way, then plotting these virtual times cumulatively. The number of people who actually leave the stadium by any time “T” is represented by the lower curve “D” (for actual departures), and the shaded area between the two curves is the total delay collectively incurred by all pedestrians in the system.
 This queuing diagram is a means of displaying real, measurable data. The only conjecture here is in the slope of the lower curve, which assumes that, if not impeded by some additional queue further downstream, people pass through the gate at its capacity whenever a bottleneck forms. This maximum rate is independent of both the number queued and the proportion of pedestrians coming from each section of the stands.
Now suppose a stadium employee acts as a kind of ramp meter by restricting the rate at which people from the bleachers merge into the common stream. Speed and flow would increase for those coming from the reserve seats; and, since they’d leave the stadium at a higher rate, they’d suffer less delay. Nonetheless, the metering hasn’t changed the total amount of delay. It has merely redistributed it, reducing some delay for the reserved seats but creating more delay for the bleachers. Figure 2 shows that total delay is unchanged as long as the two curves are unaltered; that is, as long as the same number of people are trying to get out and the gate’s capacity remains the same.
But suppose people coming from the bleachers are restricted so much that fewer people than the gate’s capacity come through. In this case, people from the reserved seats won’t have to queue up. The flow of people on this path will be higher than it was without the metering. Yet total delay in the system, as well as the duration of the rush, would both increase, since people leave the stadium at a lower rate than the maximum possible. This would show up on Figure 2 as a drop in the slope of “D” and an increase in the size of the shaded area.
The key to holding down delay is keeping the outflows from the whole system as high as possible. Maximizing outflows should be a primary objective when setting up metering plans. It holds true for the simple system in Figure 1 as well as for complex freeway systems.
A Congested Off-Ramp And What A Meter Can Do
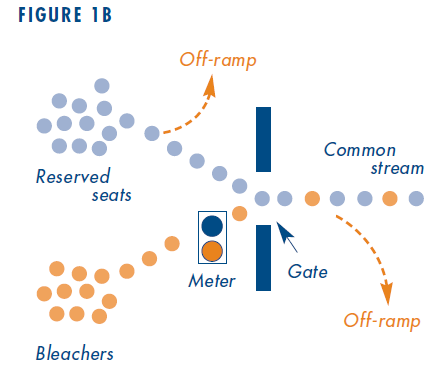
 Now go back and complicate the original scenario with some off-ramps. Queues have formed on both paths. Next put in another exit, an “off-ramp” before the common stream, on the path from the reserved seats (Figure 1B). If we metered the bleachers just enough to increase the rate of people coming from the reserved seats, we could increase outflow, since people from the reserved seats could now get to that first exit sooner. Thus we could reduce delay in the entire system, though people coming from the bleachers may not know it.
But suppose there’s also an off-ramp just beyond the gate, and that this second off- ramp’s capacity is less than the gate’s. Some proportion of those entering the common stream from both the bleachers and the reserved seats are bound for this off-ramp. Even with the current metering scheme in place, problems can arise if the number of people headed for the second off-ramp exceeds that ramp’s capacity. The off-ramp would be unable to absorb the extra people, and a queue would form in the common stream that could eventually block the gate. In this case, the flow approaching this downstream off-ramp diminishes as traffic is blocked by the queue for the off-ramp. The extent to which the flow diminishes depends upon the proportion of people in the common stream who are bound for that off-ramp; a higher proportion of these people means a greater reduction in flow, and an increase in delay.
Obviously, metering can’t increase the off-ramp’s capacity. But it can affect who’s in the queue upstream, and this can have either positive or negative effects on the system. If, for example, most of the people bound for the problematic off-ramp happen to come from the reserved seats, the metering scheme in place would have exacerbated the problem by allowing a higher proportion of people headed for this ramp to enter the common stream. What’s needed instead is a scheme to reduce that proportion.
Metering For Off-Ramp
Empirical evidence shows that people driving vehicles on a freeway behave much the same as our pedestrians in the stadium. Some traffic engineers have conjectured that by eliminating queues, on-ramp meters can increase capacities at merge bottlenecks. But, to date, conclusive evidence of this is scarce, and further empirical study on the subject is needed.
Also, many engineers erroneously see higher vehicle speeds and flows on sections within a freeway system as evidence that a metering scheme has diminished delay. The potential flaw in this reasoning was evident in the stadium analogy. Before introducing off-ramps to the simple system, our metering method promoted higher speed and flow for one path but could not lessen overall delay. An overly restrictive scheme even resulted in greater delay.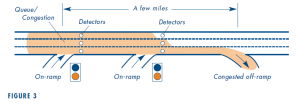
In the real world, metering schemes often function with what is called a “demand- capacity” logic. According to this logic, on-ramp metering rates are established to keep flows on each freeway section from exceeding that section’s estimated capacity. But this is not appropriate for a freeway with a congested off-ramp. For example, some metering algorithms adjust an on-ramp’s metering rate according to roadway occupancies measured downstream. At regular intervals the metering is made more—or less—restrictive if the measured occupancy is above—or below—some specified target, typically the highest number of vehicles that flow freely on that freeway section.
But suppose we used this metering plan on the freeway stretch shown in Figure 3. The off-ramp near the downstream end of this section becomes congested during the rush. Its queue, shaded in the figure, backs up from the off-ramp onto the freeway and propagates backward past two neighboring on-ramps upstream. Each of these on-ramps’ detectors then measures an occupancy above the target and adjusts to a more restrictive metering rate.
However, relatively few, if any, of the vehicles from these nearby on-ramps are likely to be bound for the congested off-ramp, because most trip lengths on a freeway are more than a few miles. So, by restricting inflows from these nearby on-ramps, the meters have inadvertently created a mix of freeway traffic having a higher percentage of vehicles headed for the problem off-ramp. As in our stadium analogy, this reduces outflow and makes the queue upstream even denser. The on-ramps’ detectors then measure occupancies farther above the targets. A downward spiral may thus occur, whereby at regular intervals metering at nearby on-ramps becomes more restrictive, in turn intensifying queuing and increasing delay.
Even if not subjected to perverse outcomes like the one above, congested off-ramps can create huge delays. Fortunately, there are effective traffic management strategies for this type of bottleneck. For example, one might coordinate the metering rates at multiple on-ramps in selective ways. Those on-ramps serving higher numbers of vehicles headed for the congested off-ramp can be metered more restrictively than others.
Moreover, traffic management strategies suitable for this kind of congestion are not limited to on-ramp metering. In many cases the simplest solution is to increase the rate at which vehicles can discharge from off-ramps. This would commonly entail treating bottlenecks on nearby surface streets, since off-ramp queues often reverberate from them.
Some Final Thoughts
 No single metering scheme can address all freeway conditions. So a metering plan, or any traffic management strategy, should be designed only after the particular freeway system has been carefully examined and all its sources of delay identified. Unfortunately the literature has surprisingly little to say on this subject. Most reports promoting or criticizing demand-capacity schemes make no mention of their limitations in addressing congestion from off-ramps.
To the contrary, the literature gives the impression that some of the best-known metering algorithms follow from the assumption that all freeway bottlenecks are merge bottlenecks. But freeway bottlenecks come in many flavors, including those created by congested off-ramps.
Further Readings
Michael J. Cassidy, Shadi B. Anani, and John M. Haigwood, “Study of Freeway Traffic Near an Off-Ramp,” Transportation Research, vol. 36A, 2002; or PATH Working Paper 2000-10.
Michael J. Cassidy. Critique of a Freeway On-Ramp Metering Scheme and Broader Related Issues. Report 2002-4, Institute of Transportation Studies, University of California, Berkeley. 2002.
Carlos F. Daganzo, “The Nature of Highway Gridlock and How to Prevent It,” in: J.B. Lesort (Ed.), Transportation and Traffic Theory, Amsterdam: Elsevier, 1996.
Carlos F. Daganzo, Jorge Laval, and Juan Carlos Munoz. Some Ideas for Freeway Congestion Mitigation with Advanced Technologies. Draft Final Report, California PATH program, University of California, Berkeley. 2001.
Juan Carlos Munoz and Carlos F. Daganzo. “The Bottleneck Mechanism at a Freeway Diverge,” Transportation Research 36A, 2002 or PATH Working Paper 2000-13.