[sharelines]Price adjustments redistribute parking demand.
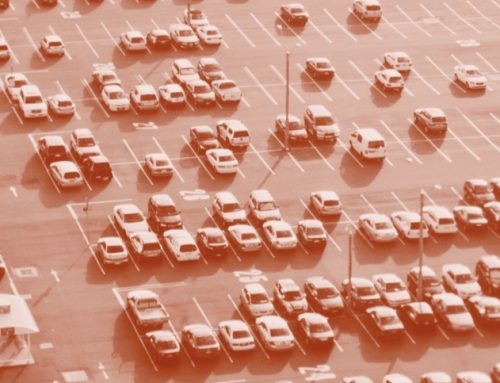
Parking management has been a vexing problem for cities since the invention of the automobile. Among the concerns are traffic congestion, air pollution, and greenhouse gas emissions caused by drivers searching for available parking—an activity colloquially known as cruising. Cruising for parking in a 15-block business district in Los Angeles has been estimated to produce 3,600 miles of excess travel each day—equivalent to two round trips to the Moon each year.
Many cities try to reduce cruising by increasing the supply of parking. They require private developers to provide off-street spaces to accommodate the expected demand for [free] parking, and they provide public garages to make up for shortages at the curb. These minimum parking requirements have been standard practice in US cities since the 1950s.
Although cities have increased the supply of off-street parking, they have neglected to manage on-street spaces. Because they seem unable or unwilling to properly price scarce curb spaces and enforce restrictions, cities suffer from cruising, double parking, and illegal parking in bus stops and other restricted zones. If the price of off-street parking is higher than the price of parking at the curb, drivers will rationally choose to cruise.
Recently, a wave of interest in more effective curb parking management, particularly through performance-based pricing, has arisen in cities as diverse as Seoul, Mexico City, New York, Seattle, Los Angeles, and Budapest. The movement is exemplified by San Francisco, which introduced variable priced parking to improve space availability and reduce cruising.
Here we evaluate the effectiveness of the pilot San Francisco initiative, SFpark. We ask whether it succeeded in reducing cruising and examine how to set performance targets to achieve a given level of parking availability.
About SFpark
One of the defining features of SFpark is that it adjusts parking meter rates based on occupancy levels observed over the previous weeks or months, with the aim of achieving a per-block occupancy rate between 60 and 80 percent. The city increases meter prices by 25 cents per hour if the occupancy on a block exceeds 80 percent, and reduces the price if the occupancy is less than 60 percent. By adjusting the price, the city expects to redistribute parking demand from very crowded blocks to less crowded ones.
By adjusting the price, the city expects to redistribute parking demand from very crowded blocks to less crowded ones.
A system of parking sensors tracked occupancy levels in both pilot areas where meter prices changed, and in control areas where meter prices remained unchanged. The sensors provided detailed occupancy data, which the city used to adjust rates about every six weeks. The six-week frame was selected to allow users to become accustomed to the new prices before making additional changes. The sensors, which have a limited lifespan, were disabled at the end of 2013. Since then, SFpark has adjusted meter rates using meter payment data to estimate occupancy.
Our study of SFpark uses the sensor data. We obtained occupancy snapshots every five minutes over a six-week period, and average hourly occupancy rates over a two-year period. We used the five-minute snapshots to model the likelihood that a space would be available, given the block size and an hourly average occupancy. We then developed a simulation model to estimate the amount of cruising by calculating the distance a driver must travel before finding an available space.
Setting a Parking Occupancy Target
Any occupancy target represents a tradeoff. The lower the occupancy, the easier it becomes for drivers to find a space and the less they will cruise to find a vacant spot. A lower occupancy, however, also means that curb spaces are idle more of the time, which wastes the space and deprives the city of revenue from parking meters.
One rule of thumb that has gained wide policy traction is to use an average occupancy rate of 85 percent to eliminate cruising. This rate would ensure that at least one parking space is available on every block at all times. To achieve this 85 percent occupancy rate, parking prices should vary throughout the day and across different blocks. The 60–80 percent target occupancy under SFpark, by contrast, is slightly lower than the widely accepted rate of 85 percent. The rationale of SFpark is the variability in parking demand. An occupancy rate of 60–80 percent averaged over a period of time may include moments where occupancy exceeds 85 percent and even reaches 100 percent.
Any occupancy-based goal, however, is somewhat arbitrary. More importantly, it does not relate directly to public policy goals of improving availability and reducing cruising. Driver behavior is not guided by average occupancy on a block. Rather, it is guided by price and availability. Knowing that the average occupancy is 85 percent is little comfort if a block is full.
Moreover, more people try to park at high-demand times and are therefore exposed to crowded parking conditions. For example, take a block that is empty half the time, fills up very rapidly, and then remains full. When full, drivers will continue to arrive but be forced to seek parking elsewhere. Objectively, this block has an average occupancy rate of about 50 percent, yet only one user experiences it as 50 percent full. The vast majority of parkers, or would-be parkers, arrive after the block is full and experience it at 100 percent occupancy. While the average occupancy target may thus be met, the user experience still leaves something to be desired.
Therefore, the variable relevant to policy is the demand-weighted probability that a block is full. We use the sensor snapshot data to calibrate the relationship between this measure and the average occupancy. We find that block size and the length of the averaging period are important practical factors to consider when measuring the performance of the 85 percent rule of thumb.
The size of the block is important.
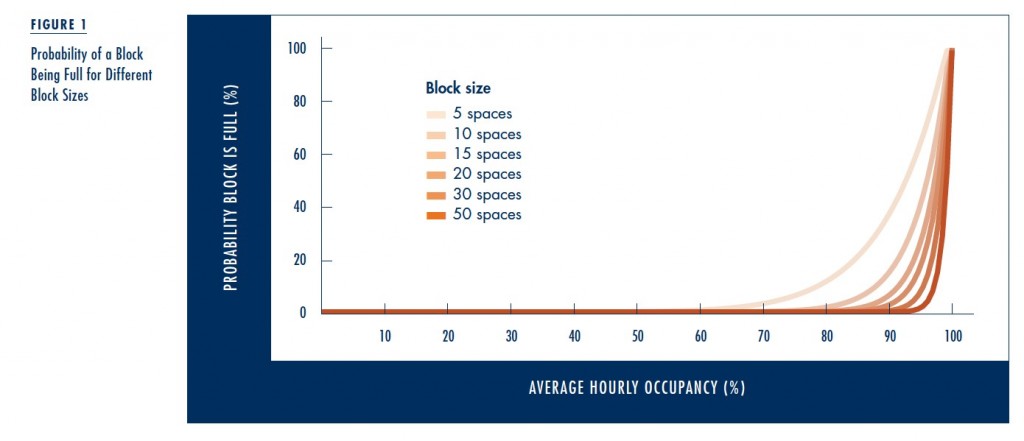
The relationship between block size (number of spaces) and the probability of unavailable parking is shown in Figure 1. For any given occupancy level, the probability that a block is full decreases as the size of the block increases. This makes intuitive sense and suggests that a uniform occupancy target across all block sizes may be inappropriate from a policy perspective. For very large blocks, a parker has a good chance of finding a space even when more than 90 percent occupied. In this case, the occupancy target could be increased to 90 or 95 percent.
The rate of observations and the period over which the average occupancy is measured matter.
Consider, for example, a block with 85 percent average occupancy. If the average is based on five observations in a five-minute period (i.e., one observation per minute), then it is highly unlikely that the block is ever full during this time. At the other extreme, if the average is computed over a 24-hour period with one observation made every hour, the chances are much greater that the block was actually full over some periods and quite low during others. Therefore, if a two-week period of averaging is used, as in the case of SFpark, then a lower occupancy target may be appropriate to ensure parking availability and reduce cruising.
The takeaway message: the fewer spaces on the block and the longer the period of averaging, the lower the occupancy target needs to be to achieve parking availability.
Does SFpark Reduce Cruising?
Our simulations suggest that SFpark worked. Occupancy levels moved towards the 60–80 percent target range. In addition, cruising fell by more than 50 percent over a two-year period in the SFpark pilot areas compared to the control neighborhoods.
Our simulations suggest that SFpark worked.
The two years of our data occurred during a rebounding local economy, when parking pressures would be expected to intensify. In fact, there was little change in occupancy in the pilot areas—reflecting the success of SFpark—while parking availability and cruising worsened in the control areas.
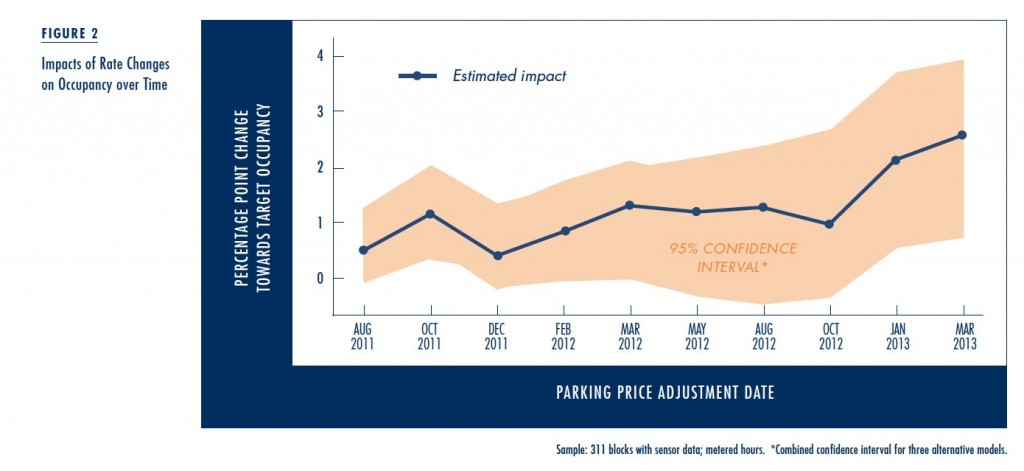
Success, however, did not happen overnight. On average, each individual rate adjustment brought a block 0.1–0.2 percentage points closer to the 60–80 percent target range (Figure 2). It took nearly two years for these small changes to grow into a larger and statistically significant cumulative effect, with an average difference of 1–2 percentage points after ten rate adjustments. For example, a typical block with 84 percent occupancy fell to 82–83 percent occupancy over two years, while a block with 50 percent occupancy rose to 51–52 percent.
That SFpark took time to influence behavior should come as no surprise. Almost all rate adjustments were just 25 cents, up or down. Drivers are presumably reluctant to forgo the first available space in the hope of saving a quarter and finding a space on a neighboring block. Only when rate differentials between neighboring blocks grew larger over time did the incentive to seek out cheaper parking increase substantially. Moreover, it is unclear how many motorists were aware of the differential rates and the opportunity to save money by choosing a space on a more distant block. Some hold disabled placards and can park for free at meters by state law. According to City of San Francisco surveys, about 20 percent of metered spaces are occupied by disabled placard holders.
SFpark effects on cruising were smaller—but still encouraging—compared to its effects on occupancy. In pre-SFpark baseline simulations, the average motorist could find parking within just 0.13 blocks—equivalent to about 50 feet, or just a few seconds. (This does not include the distance driven partway along the block where the driver ultimately finds a space.) Our simulations suggest that each rate adjustment reduced the average search for parking in the SFpark pilot by about a hundredth of a block (roughly four feet) compared to the control areas. The cumulative impact after the tenth rate change was between 0.07 and 0.17 blocks (roughly 30 to 70 feet).
This reduction in cruising seems small but is more than 50 percent less than our baseline. In other words, SFpark produced a small absolute but large relative reduction in cruising.
Differences in Perception and Data Collection
 Almost any resident or visitor to San Francisco can regale you with stories of their parking miseries. Self-reported survey data also indicates that cruising is a major problem. How is it we have data suggesting an average distance cruised of just 50 feet but perceptions of much longer times?
Two separate pieces of data from the San Francisco Municipal Transportation Agency (SFMTA) provide useful points of comparison. Parkers interviewed on the street reported an average search time of more than six minutes (albeit down from more than 11 minutes before SFpark was implemented). Meanwhile, bicycle surveyors, who followed a predetermined route in certain neighborhoods, found that average search time for an available space ranged from just over 30 seconds in the early mornings, to nearly two minutes at lunchtimes.
The face-to-face SFMTA surveys show markedly more cruising than both the bicycle surveyors and our own results. Thus, cruising may partly be a problem of perception. Differences between the reported cruising times may also arise if some of the interviewees searched for a zero-cost space on a residential street, passing up an available metered space.
The contrast between our own results and the bicycle surveys may be due to methodological differences. For example, we do not count the distance traveled on the block where a driver ultimately finds a space. If parking were available on the first block, we would register zero cruising, while the SFMTA surveyors would count up to the length of the block, typically 400 feet. We also sample all blocks in sensor-equipped neighborhoods, while the SFMTA’s predetermined survey routes tend to start on the busier commercial streets and ignore vacant parking spaces that may be visible on side streets.
Metering: Locations and Times
Our interpretation is that cruising may indeed be a problem, both before and after SFpark, but mainly on blocks without meters or in the evenings after meters have switched off. (The analysis described above only considers metered blocks during metered hours.) Motorists cruising for a parking space during the daytime may forgo a readily available metered spot in the hopes of finding a no-cost parking space (or one with a longer time limit) on a residential side street. In the evening, our data show that cruising increases markedly in many neighborhoods around 5 pm, an hour before parking becomes free at 6 pm. A driver arriving at 5 pm will be able to pay for just one hour and park until the next morning.
Figure 3 illustrates the patterns of parking and cruising over the course of an average weekday in three distinct neighborhoods. Fisherman’s Wharf is a tourist-oriented destination and part of the SFpark pilot. The Marina is a mixed-use commercial district and an SFpark pilot neighborhood. Inner Richmond is a similar commercial district, but in a control area where meter rates remained unchanged.
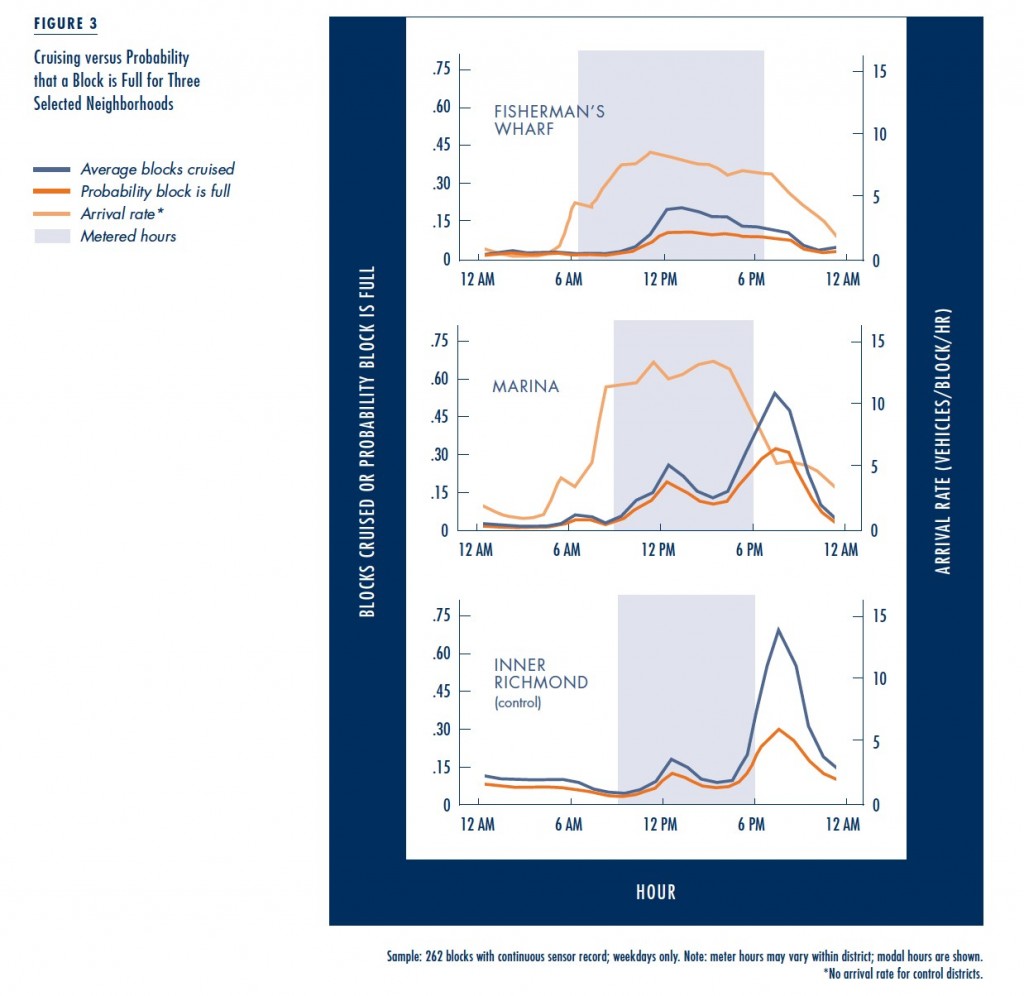
In both commercial districts (the Marina and Inner Richmond), cruising remains low for most of the day, with a small peak around lunchtime. Cruising then rises dramatically around 5 pm as the rush of restaurant goers and returning residents begins, and peaks around 8 pm. The evenings show much less cruising in Fisherman’s Wharf, a neighborhood where there are fewer local residents and neighborhood-oriented businesses. Given the apparent effectiveness of pricing, a possible next step for SFpark to reduce cruising would be to extend the hours of meter operation to all periods of excess occupancy.
Conclusions
San Francisco’s parking experiment, SFpark, is the first large-scale experiment with performance-based management of on-street parking. Judged by its impact—improved parking availability and reduced cruising—it has been a success.
Several lessons can be taken from the San Francisco experiment. First, small changes in meter rates, such as 25 cents per hour, are unlikely to have much impact on driver behavior. There is only a discernible effect on occupancy and cruising after individual meter rate changes combine to form much larger price differences between nearby blocks, and after drivers have time to adjust to the patterns of prices. Cities that want to change parking availability or cruising will need to consider more substantial price changes that are immediately noticeable, or have a long-term strategy of small-but-frequent rate adjustments.
Second, few cities will be able to replicate the expansive (and expensive) network of in-street sensors that San Francisco used to monitor occupancy and make rate adjustments. Fortunately, similar results may be possible with simpler methods, such as using transaction data or occasional manual surveys.
Third, sensors provide a precise estimate of average occupancy, but that measurement only loosely relates to cruising, driver frustration, and the probability that a block is full.
Finally, while a performance-based strategy such as SFpark can succeed, most of the gain occurs simply from pricing parking in the first place. For a city such as San Francisco, extending meter hours into high-demand times in the evenings and on Sundays, or pricing parking on unmetered residential streets, would provide a bigger win than adjusting rates where meters already exist. At least in San Francisco, cruising does not appear to be a major problem when there are meters in operation. Rather, the fabled scarcity of parking in urban neighborhoods results primarily from drivers searching for a free parking space.
This article is adapted from “Is the Curb 80% Full or 20% Empty? Assessing the Impacts of San Francisco’s Parking Experiment,” published in Transportation Research Part A: Policy and Practice.
Further Reading
Daniel G. Chatman and Michael Manville. 2014. “Theory versus Implementation in Congestion-Priced Parking: An Evaluation of SFpark, 2011–2012,” Research in Transportation Economics, 44(1): 52–60.
Adam Millard-Ball, Rachel Weinberger, and Robert C. Hampshire. 2014. “Is the Curb 80% Full or 20% Empty? Assessing the Impacts of San Francisco’s Parking Pricing Experiment,” Transportation Research Part A: Policy and Practice, 63: 76–92.
San Francisco Municipal Transportation Agency. 2011. SFpark: Putting Theory into Practice, San Francisco: SFMTA.
Donald Shoup. 2011. The High Cost of Free Parking, Chicago: Planners Press.