Australia—or Oz as it is colloquially known—is instantly recognizable to visiting Americans, even those like myself who had never been there before. As in the US, most of Australia’s population lives in metropolitan areas within twenty miles of the coast. A majority of Australians live in suburban communities, and single-family homes are the dominant housing form. Australia’s home ownership rate stands at seventy percent, slightly above the US rate.
 The transportation picture also looks familiar, at least at first glance. GM (through its Holden Division), Ford, and Toyota are Australia’s biggest auto manufacturers, and four-wheel drives, minivans, and SUVs (known locally as “utes” and “soft-roaders”) are popular among suburban households. Urban and suburban traffic congestion is LA-like in its severity, especially in and around Australia’s two largest cities, Sydney and Melbourne. After years of under-investment, Australia’s urban transit systems are facing widening revenue shortfalls. In terms of new investments, light rail is popular with local elected officials, while transit professionals generally favor bus rapid transit. Support is also growing for transit-oriented development to combat auto dependence and better coordinate public transportation investments with private land use decisions.
Early twentieth-century land use patterns in Australia’s major East Coast cities— Sydney, Melbourne, and Brisbane—were shaped by a combination of privately and publicly developed streetcar systems. As a result, the inner ring of older suburban neighborhoods in all three cities is compact and walkable. Sydney dismantled its tram system in 1962 to promote private vehicle use, followed by Brisbane in 1969. Melbourne still operates an extensive 150-mile, 500-tram streetcar system carrying more than 400,000 riders every day. Billed as the largest tram network in the English-speaking world, most Melbourne trams share street space with local auto traffic.
For Want of Urban Freeways
Perhaps the biggest difference between US and Australian transportation systems is in how major intrametropolitan expressways were planned and developed. Whereas the US interstate and intrametropolitan freeway system was planned, developed, and mostly paid for by the federal government in the 1950s and 1960s, in Australia the construction of major expressways and tollways had to wait until the 1990s, and went without national funding.
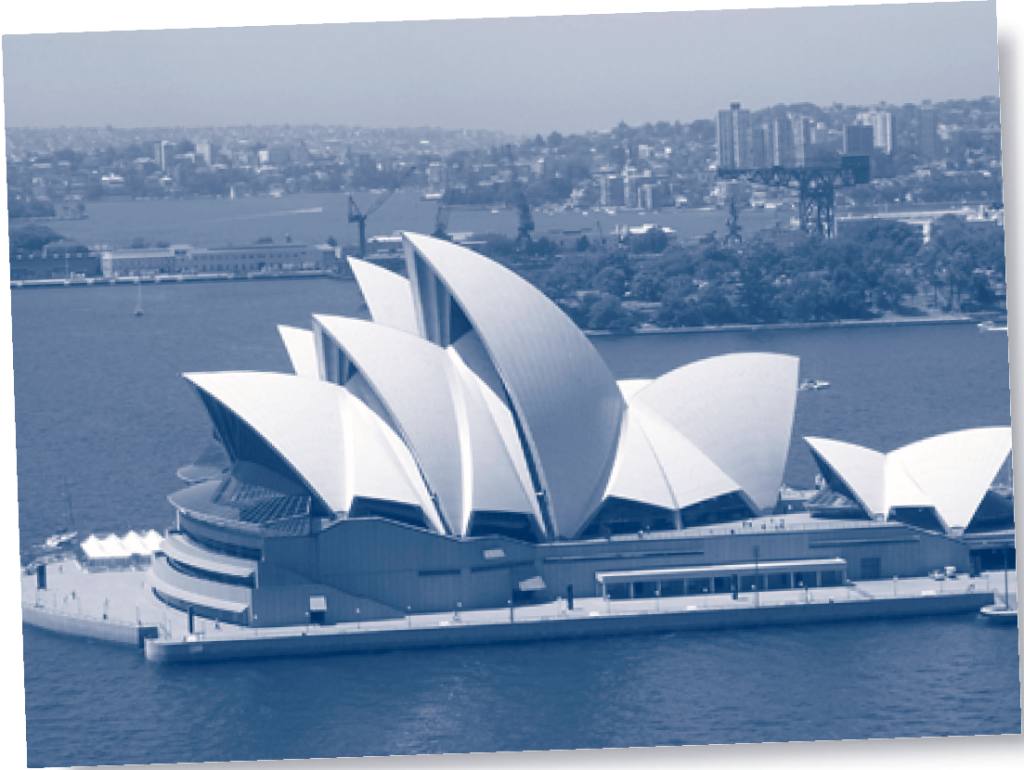
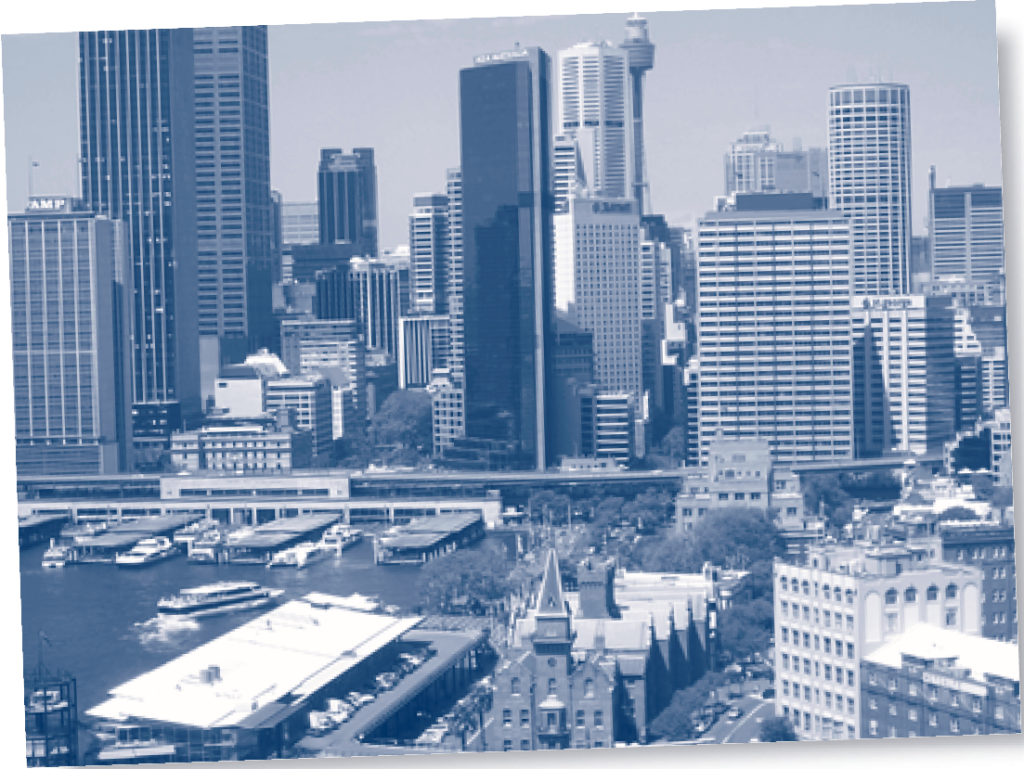
The implications of this difference are enormous. Without the benefit of freeways as an organizing skeleton, Australia’s postwar suburbs developed individually and willy-nilly. Whereas America’s postwar suburbs sprawl contiguously outward along recognizable freeway spines, Australian suburbs just sprawl. Leapfrog development, which has mostly been eliminated from American metropolitan areas, is still 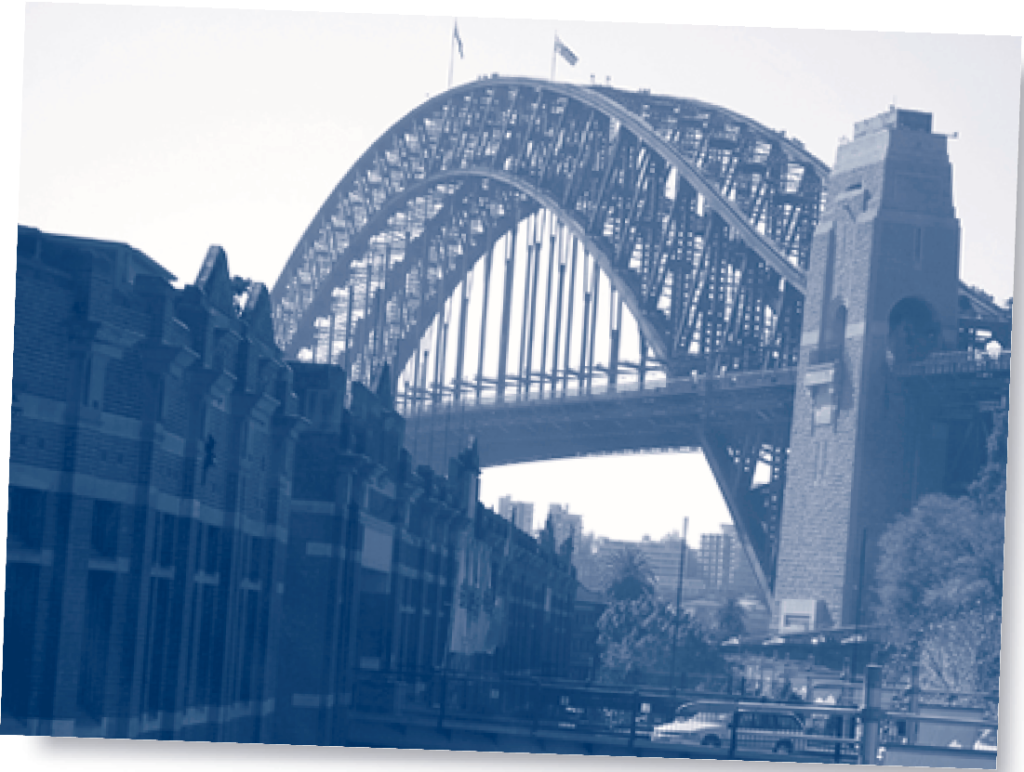 commonplace in Australian suburbs. Instead of locating along freeways or expressways where they are easy for regional shoppers to get to, Australia’s suburban malls are located in suburban centers and along connecting arterials, where they conflate regional and local traffic congestion. If there is a good side to the lack of suburban freeway capacity it is that many of Australia’s major employers have remained downtown—where they can be served by public transit—instead of migrating to suburban office parks. But this too is now changing. Sydney’s most recent metropolitan development plan, known as the Metropolitan Strategy, foresees and indeed encourages job decentralization to multiple suburban job centers.
When Australia’s three largest state governments (New South Wales, Victoria, and Queensland) finally did embark on a program of metropolitan freeway building in the 1990s, they faced additional costs and difficulties. Because the suburban landscape was already substantially developed, right-of-way acquisition was extremely expensive. The engineering and design challenges of linking new facilities to existing regional transportation facilities like Sydney’s Harbor Bridge and downtown Cahill Expressway proved daunting. Residents of established suburban neighborhoods were none too happy about having regional roadways cut through their communities. The national government in Canberra was no help. Instead of using its financial capacity to help state governments build a seamless, nationally connected transportation system, Canberra eschewed debt-financed infrastructure construction altogether. In terms of planning and financing new transportation projects, this left state and local governments on their own.
The Rise (and Overreach?) of PPPs
Local governments solved this dilemma by enlisting the help of the private sector in a series of arrangements that came to be known as PPPs, or Public-Private Partnerships. Similar to the Build-Operate-Transfer model of infrastructure construction used in the developing world, PPPs work as follows: the public sector—in Australia’s case, a state government—contracts with a private-sector consortium made up of a building contractor, a maintenance company, and a bank lender to build, operate, and maintain a particular facility. The consortium raises investment capital, operates the facility, and collects user fees—or in the case of roadways, tolls. At the end of the contract period (usually between twenty and thirty years) the facility may or may not revert to government ownership. From the government’s perspective, PPPs have many advantages. They benefit from the private sector’s experience in managing development risk and its ability to mobilize private investment capital, and they keep financing costs off the government’s ledger. The private sector consortium receives up-front development and financing fees from the government, as well as a portion of ongoing toll payments. Most of the toll revenue goes to repay investors. (A similar model was used in Orange County to develop the SR91 tollway.) The PPP Model was introduced in Australia in 1986 by the New South Wales government to build the Sydney Harbor Tunnel, which connects North Sydney to the Sydney Central Business District (CBD) underneath the iconic Sydney Harbor Bridge. Subsequent PPPs were used to build a host of expressways and tunnels throughout metropolitan Sydney. The PPP model has also been used in Melbourne to construct two new freeways, the Western Link (running north-south and connecting Melbourne’s western suburbs), and the Southern link (running east-west through and under Melbourne’s central area).
 Controversy over the PPP-tollway model has focused on two points. The first is whether the public sector could have developed similar facilities at a lower cost. The second focuses on whether the tolls are higher than need be, given that returns paid to investors have been consistently higher than the government’s borrowing costs. These disagreements aside, there is little doubt that the PPP approach has proved to be a workable model for retrofitting desperately needed freeways into Sydney and Melbourne’s existing metropolitan fabric.
When used to build tunnels, PPPs have been a mixture of good and bad. On the good side of the ledger is the Sydney Harbor Tunnel connecting the Warringah Freeway in North Sydney and the Cahill Expressway in the Sydney CBD. Opened in 1992, the Sydney Harbor Tunnel was initially criticized for its half-billion dollar construction cost, its unusual immersed modular tube construction, and the fact that it guaranteed returns based on projected traffic volumes rather than actual use. Now the Tunnel is an integral component of Sydney’s cross-harbor transportation system, carrying about 85,000 inbound vehicles per day—about half the traffic of the nearby Sydney Harbor Bridge, but more than twice the average daily ridership of the Sydney Ferry system. The additional vehicle capacity afforded by the Sydney Harbor Tunnel enabled the Sydney Harbor Bridge to convert one of its automobile lanes to a dedicated bus lane, and today, according to government statistics, peak-hour buses crossing the Sydney Harbor Bridge carry thirty percent more commuters than the Bridge’s other seven traffic lanes combined. Not all PPP experiences have been so positive. Opened in August 2005, the 1.2 mile Cross-City Tunnel, which connects Sydney’s eastern and western neighborhoods, is proving far more controversial. As part of the contract awarded to the Cross-City Tunnel Consortium (a partnership of an Australian construction company and investors from Hong Kong and the US), the New South Wales (NSW) government agreed to close competing surface streets. Initial projections were that the Tunnel would carry 85,000 vehicles per day. One month after its opening, fewer than 25,000 vehicles were using the Tunnel and surface street traffic congestion was worse than ever. With Sydney’s newspapers accusing the New South Wales government of incompetence and Tunnel investors growing increasingly nervous, speculation arose that the NSW government would be forced to buy out the Consortium’s financial interest at a $300 million premium. This was denied vigorously by both parties, who insisted that tunnel usage would eventually rise and that they were “in it for the long haul.” To attract more users and assuage growing public anger, the Consortium announced in March 2006 that the toll would be cut in half for three months, and that some existing road closures would be reversed. Two days prior to the end of the half-price toll period, NSW Premier (i.e., Governor) Morris Iemma summarily ended negotiations with the Consortium without an agreement, and in contravention to the original contract, announced the reversal of several road closures.Where things go from here will depend on the results of NSW state elections, which were held on March 24, 2007.
There is little doubt that the PPP approach has proved to be a workable model for retrofitting desperately needed freeways into Sydney and Melbourne’s existing metropolitan fabric.
Off the Roads and On the Bus: Three Approaches to BRT
Australia has also emerged as an international leader in the construction of bus rapid transit (BRT) systems, with four BRT routes now in operation and two more under construction. Australia’s first BRT system was developed in the 1970s to link several suburban towns around Canberra, Australia’s capital.
 Far better known is Adelaide’s O-bahn system, which was completed in 1986. Built in place of a freeway extension and as a more flexible and less costly alternative to light rail, the 7.5-mile O-bahn system was conceived in partnership with Daimler Benz (now DaimlerChrysler). It is unique in that buses run on a specially built track that cannot be used by cars or other private vehicles. The O-bahn’s one station and two interchanges allow regular local buses to enter and exit the system as part of their normal suburban routes. O-bahn buses run up to sixty miles per hour with one-minute headways during the weekday peak and three- to five-minute headways during non-peak periods. During its first ten years of operation, O-bahn patronage increased seventy percent, while its service area population increased by twenty percent. Patronage levels declined some- what during the late 1990s as a result of fare increases. Current O-bahn patronage levels are on the order of 20,000 riders per day, forty percent of whom previously drove. Its ridership appeal notwithstanding, according to a 2003 TRB study comparing Australian BRT systems, the Adelaide O-bahn has had little effect on urban development patterns or on nearby property values.
Brisbane’s ten-mile long South East Busway has had much greater ridership, mode share, and property value impacts. Opened in two phases in 2000 and 2001, the busway connects Brisbane’s CBD to the city’s southern suburbs, and is used by approximately 70,000 riders everyday. With a dedicated bi-directional right-of-way in an expressway median, and ten easy-on/easy-off stations, the South East Busway is used by 117 separate bus routes. Headways range from thirty seconds near the CBD to three minutes at the suburban terminus.
The South East Busway has clearly made transit use in Brisbane faster and more convenient, but has it lured drivers from their cars? While a precise answer to this question will have to await the next national census, one survey puts the share of Busway riders who previously drove at 26 percent. The same 2003 TRB study that found Adelaide’s O-bahn system to have had no impact on property values concluded that the South East Busway has led to a twenty percent gain in nearby property values, and that homes within six miles of the Busway increased in value two to three times as fast as more distant properties.
The Sydney region is taking a different approach to bus rapid transit. Instead of connecting the Sydney CBD to its western suburbs—a service provided by commuter trains—the 18.5 mile long Liverpool-Paramatta Transitway (LPT) connects several of the region’s fast-growing suburban centers. Opened in February 2003, the LPT includes twelve miles of bus-only right-of-way located in the median or adjacent to existing arterials, and 35 stations spaced at approximately 800-meter intervals. In contrast to Adelaide and Brisbane, use of the LPT is not open to local buses. Articulated buses powered by compressed natural gas run every ten minutes during peak periods and every fifteen to thirty minutes during the off-peak. Fares are assessed zonally, and are comparable to other suburban bus routes.
While peak-period buses often run full, in what seems to be an endemic problem for all Sydney area transportation projects, patronage has been much less than originally forecast. A 2005 review of the LPT conducted by the New South Wales Audit Office concluded that although customer satisfaction was quite high, final construction costs had exceeded initial estimates threefold, and that, even allowing for further patronage increases, the system would continue to operate in the red.
How Not to Run a Railroad, and Other Political Observations
Sydney relies on its public transit system more than any other Australian city, and without it, the Sydney metropolitan area would be unlivable—a seventeen-day rail strike in 1983 brought the city to its knees. These days, most of the 186,000 commuters who daily swell the ranks of Sydney’s CBD arrive by bus or rail. Altogether, metropolitan Sydney’s transit systems carry nearly two million passengers each weekday. Public transit is Sydney’s lifeblood, yet by common agreement, the quality of transit service in Sydney—especially it s rail service—has grown steadily and noticeably worse since the 2000 Sydney Olympics.
Sydney’s eleven commuter rail lines and four inter-city lines are run by CityRail, a subsidiary operator of RailCorp, the government agency responsible for all passenger rail services in New South Wales. CityRail operates a fleet of more than 1,500 double-decked transit cars over 1,300 miles of trackbed serving 302 separate stations.
All CityRail services (as well as the independently-operated Metro Tram light rail service) converge at Sydney’s Central Station, which is located about a half-mile south of the Sydney CBD.
CityRail service suffers from three types of problems. The first is simple age. In the build-up to the 2000 Sydney Olympics, CityRail devoted most of its capital resources to system expansion and not to replacing equipment. As with any aging vehicle fleet, reliability is on the decline. CityRail’s second problem is that traincar operators are leaving or retiring faster than they can be replaced. Its third and most serious problem is that because so many different lines share a common trackbed, breakdowns and delays on any one line quickly cascade throughout the entire system.
CityRail’s own benchmarks stipulate that at least 92 percent of peak-period trains should keep to within five minutes of their designated arrival timetables. As of 2004, every major CityRail line missed its performance benchmarks, in some cases by as much as thirty or forty percent. CityRail’s problems reached a crisis point in January 2003 when a train operator’s deadman’s brake failed to slow a commuter train after the operator was incapacitated by a heart attack. The resulting derailment killed seven passengers and injured many more. An official inquiry into the accident attributed some of the blame to CityRail’s “underdeveloped safety culture.”
In response, and without any immediate hope of meeting its own benchmarks, in September 2005, CityRail lowered its sights by reducing train speeds, increasing headways and station dwell times, and reducing the number of weekday trains in service by an average of twenty percent. Depending on the route, these changes added between five and twenty minutes to typical commuter trip times. They did have the desired effect, however, and on-time performance improved, although not to the level of CityRail’s 92 percent benchmark. A 2005 investigation into CityRail’s problems by the NSW Auditor General identified numerous internal management and operations problems, and also criticized CityRail for not doing a better job informing passengers about severe train delays.
 To an outsider like myself, CityRail’s problems seem to go deeper. And they are symptomatic of a pervasive and fundamental problem: the lack of political accountability. The Labor Party government’s usual response to declining public service quality is to switch mid-level managers and hope for the best. The notion that top-level public servants should be more accountable to the public than to party leadership has withered away. Missing from electoral politics in Australia is a sense of outrage—and the expectation that things can and should be better.
Many thanks to John Black, Ed Blakely, and David Henscher of the University of Sydney for their clarifications, suggestions, and comments.
Further Readings
Transportation Research Board, “Bus Rapid Transit,” TCRP Report 90, 2003.
Graham Currie. Bus Rapid Transit in Australa-sia: Performance, Lessons Learned and Futures. Planning and Transportation Research Center, 2005.