Planners and researchers use transit catchment areas—the land around stations—as geographic units for predicting ridership, assessing the impacts of transit investments and, recently, for designing transit-oriented developments (TODs). In the US, a half-mile-radius circle has become the de facto standard for rail-transit catchment areas.
There is surprisingly little evidence to justify any particular catchment area. Why a half mile? Why not a quarter mile or two-fifths of a mile? Is there anything special about a half mile or is this simply a convenient figure that has become an industry standard? A half mile roughly corresponds to the distance someone can walk in 10 minutes at 3 miles per hour and is a common estimate for the distance people will walk to get to a rail station. The half-mile ring is a little more than 500 acres in size.
Why Catchment Areas?
 Proximity to a transit station strongly influences whether people use the service. Transit patronage, in turn, influences the cost-effectiveness of transit as well as surrounding property values. Beyond a certain distance, however, transit is unlikely to influence mode choice, land values, or land use. A transit catchment area measures a station’s primary zone of influence.
The half-mile transit catchment area, whether radial- or road-network-based, is more a convenient rule of thumb than a statistical or analytical construct.
People’s willingness to walk to transit has largely defined this zone. Walking preferences, however, vary by destination, trip purpose, gender, age, land use, safety, weather, and the price and availability of parking. Furthermore, transit investments’ impacts are not limited to the average or even maximum walking distance. Many transit users access stations by car, bike, or another transit service. Road networks, moreover, do not emanate radially from transit stations, prompting some researchers to define transit catchments based on road network distances. The half-mile transit catchment area, whether radial- or road-network-based, is more a convenient rule of thumb than a statistical or analytical construct.
Transit Catchment Data and Direct Demand Models
 We tested to see whether the half-mile circle explains transit use better than other boundaries do. To this end, we estimated regression equations to predict ridership at 1,500 high-capacity transit stations in 21 cities across the US. We aimed to determine, statistically at least, whether there is a clear “winner”—a radial distance from rail stops that best explains ridership and thus can serve as a benchmark for station-area planning. We focused on ridership because the prospect of drawing travelers out of cars and into trains and buses is one of the principal justifications for TOD. Without new riders, TOD generates few economic, social, or environmental benefits.
To predict ridership, we used a direct demand model, which is based on statistical regression of observed ridership. Researchers and practitioners commonly use direct demand models as alternatives to full-blown regional travel models for early-stage testing of transit scenarios, such as predicting transit ridership at stations, along corridors, or for entire systems. Because modelers can build direct demand models with basic GIS software and readily available data, they can evaluate a large number of potential transit alternatives with relatively little effort. Transit planners also use these models because the pedestrian-scale features of a neighborhood do not show up in regional travel models. By focusing on an area defined within a specific distance from a transit station, direct demand models reflect actual land-use characteristics in the area most likely to influence transit ridership. We were able to collect data on the vast majority of urban rail stations in the US for direct demand modeling.
Without new riders, TOD generates few economic, social, or environmental benefits.
Researchers and planners often use network-based catchment areas, which are defined by road-network distances as opposed to radial distances. After testing network-based catchments in two cities, Atlanta and San Francisco, we opted to use radial ones for four reasons. First, most existing station-level direct demand models rely on radial catchment areas. Second, radial-based data are easier to calculate and more readily available, so they are more likely to see widespread use in the future. Third, estimating catchment areas requires an additional, somewhat arbitrary, decision when using Census data: determining the distance from the roadway to include in the catchment area. Fourth, and perhaps most important, the network-based calculations did not improve our results in the two test cities. This is likely because the parks, paths, and parking lots surrounding stations provide pedestrian access, but rarely show up in available road network files. Manually adding these pedestrian connections, however, is labor-intensive and therefore contrary to the direct demand model’s objective of simplifying ridership predictions. Also, despite advances in the quality and availability of satellite imagery, identifying pedestrian access points still requires site visits to transit stations. Given 1,500 stations in 21 cities, this was outside of our project scope. We therefore used the radial definition of catchment areas in our analysis.
Catchment Areas and Ridership Predictions
To our surprise, we found that varying the size of the radius around stations had only a small influence on the ability to predict ridership based on measures of surrounding population, jobs, and other variables. A quarter-mile radius explained variation in ridership across US transit stations about as well as a half-mile radius, which itself performed similarly to a three-quarter-mile radius. As expected, however, the results did indicate that the closer jobs and people are to transit stations, the more ridership the stations tend to generate. Figure 1 plots the statistical relationship between ridership and the number of nearby jobs and residents at six different catchment areas, ranging from 0.25 to 1.5 miles. We also included variables for transit frequency, bus connections, park-and-ride spaces, and geographic location in the models. Within a quarter mile of a station, for example, an additional 100 residents correlates with 34 additional trips per weekday and an additional 100 jobs correlates to 69 additional trips. Within a half mile, an additional 100 residents correlates with 25 more trips and an additional 100 jobs correlates with 42 more trips.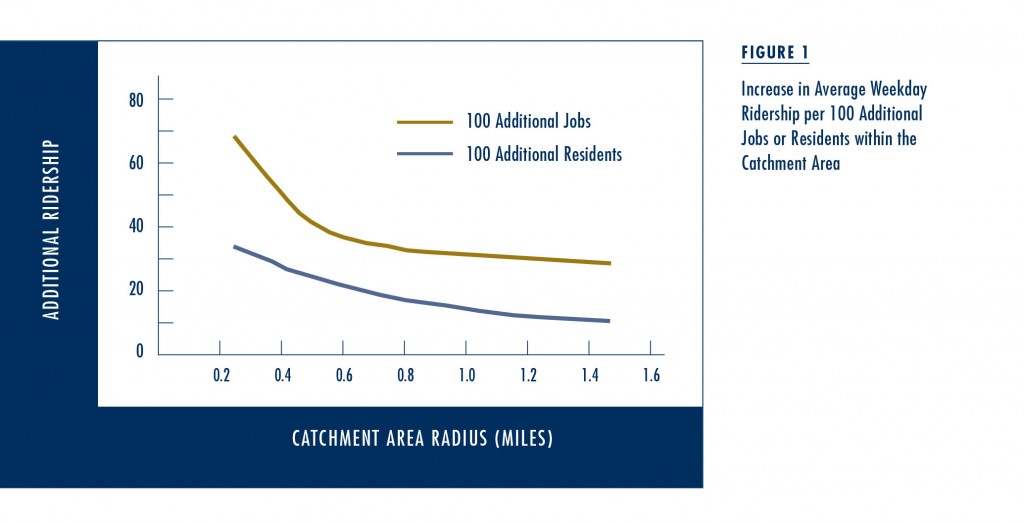
Toward a Catchment Area Norm
To define an optimal transit catchment, we combined the population and job counts from various catchments in the same model. However, due to strong relationships between catchment-based counts around each station, this produced unstable and unrealistic predictions. In other words, the number of people living within a quarter mile of a station is so closely related to the number of people living between a quarter mile and a half mile, as well as the other catchment areas, that it confounds statistical results. Through a process of eliminating and combining catchment bands, we settled on the quarter-mile catchment as the best context for modeling with job counts, and the half-mile circle as the best context for modeling with residents.
 To test whether our results were reasonable, we then examined how changes in the number of jobs and residents around stations influence ridership. We estimated that a 10 percent increase in the number of jobs within a quarter mile of a transit station corresponded with a 2 to 4.7 percent increase in average weekday ridership. A 10 percent increase in the number of residents within a half mile of a transit station corresponded with a 0.9 to a 3.5 percent increase in ridership. These estimates vary according to whether transit technology and service frequency variables were included in the model, but are in line with previous studies. While transit frequency and quality encourage transit ridership, they are also highly influenced by demand. For the most part, agencies build high-capacity subways or run frequent service only where demand is high.
Some cities have higher or lower ridership because they have developed driving or transit cultures over time, or have other attributes.
Results also depend on whether the model includes the city where each station is located. Some cities have higher or lower ridership because they have developed driving or transit cultures over time, or have other attributes. For example, transit use in Washington, DC is higher than the model would otherwise predict while it is lower than otherwise predicted in Baltimore. Removing city-level variables significantly reduces the predictive power of the models and increases the importance of jobs and population on ridership. The loss of explanatory power indicates that, in a national model of transit ridership, differences across transit systems are as important, or more important, than differences across transit stations.
Conclusion
Our results indicate that, for the purposes of predicting ridership, varying station catchment area or type offers little insight. We found the difference between using a quarter-mile or half-mile circle to be quite small. The benefits of using a diamond or network-based shape—whether adjusted for pedestrian paths or not—are equally small. As a result, direct demand modelers should use whatever catchment is most readily available or easily calculated. The half-mile circle is neither particularly well- nor ill-suited to predicting ridership.
We found the difference between using a quarter-mile or half-mile circle to be quite small.
By including and testing multiple quarter-mile radial bands, we find that, at a national scale, the quarter-mile radius generally works best for predicting ridership as a function of jobs, while the half-mile radius works best predicting ridership as a function of residents. For analysts who lack the data or resources to model multiple catchment areas or for those who need to choose an area from which to conduct surveys on transit-adjacent firms or households, our results support selecting firms within a quarter mile and households within a half mile. For planners and policy makers, the results give some credence to using a half-mile catchment area for TOD planning and confirm that there are advantages in concentrating retail and office developments even closer to stations.
This research was funded by the University of California Transportation Center and the University of California, Berkeley Center for Future Urban Transport, a Volvo Center of Excellence. The article is adapted from “The Half-Mile Circle: Does It Best Represent Transit Station Catchments?” originally published in the Transportation Research Record: Journal of the Transportation Research Board.
Further Readings
Robert Cervero. 2006. “Alternative Approaches to Modeling the Travel-Demand Impacts of Smart Growth,” Journal of the American Planning Association, 72(3): 285–295.
Erick Guerra, Robert Cervero, and Daniel Tischler. 2012. “The Half-Mile Circle: Does It Best Represent Transit Station Catchments?” Transportation Research Record: Journal of the Transportation Research Board, 2276: 101–109.
Michael Kuby, Anthony Barranda, and Christopher Upchurch. 2004. “Factors Influencing Light- Rail Station Boardings in the United States,” Transportation Research Part A: Policy and Practice, 38(3): 223–247.
Clayton Lane, Mary DiCarlantonio, and Len Usvyat. 2006. “Sketch Models to Forecast Commuter and Light Rail Ridership: Update to TCRP Report 16,” Transportation Research Record: Journal of the Transportation Research Board, 1986: 198–210.