[sharelines]Transit productivity will continue to erode without substantial subsidies or lower operating costs.
During the early years of the Great Depression, public transit ridership plummeted by one-third, marking the 20th century trend toward private automobile travel. Sixty years later, transit riding again dropped during the economic recession between 1989 and 1993 , particularly on the nation’s largest transit systems. Although the economy recovered during the mid-1990s and transit patronage stabilized nationally, ridership has not returned to pre-recession levels.
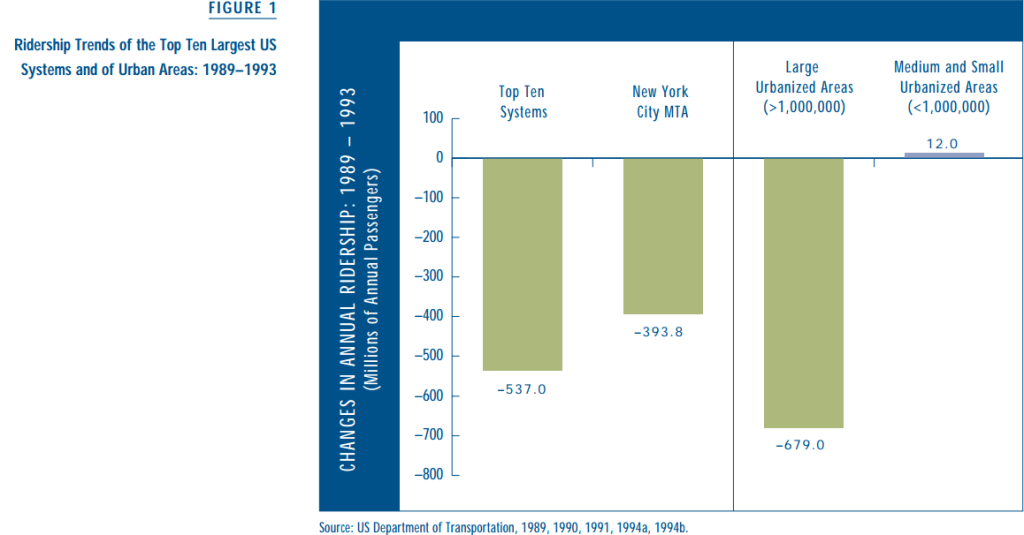
Between 1989 and 1993, the 5,000-plus public transit systems in the US lost 667 million annual riders out of 9.08 billion total. Eighty percent of these losses (537 million) were from the ten largest transit systems. Ridership on the New York City Metropolitan Transportation Authority’s system alone—by far the nation’s largest transit operator—dropped by 394 million (see Figure 1). How did the nation’s most venerable transit systems, operating in the most favorable, high-density markets, lose so many riders?
The factors affecting ridership are unique to each transit system, but several universal influences are also clearly at work. First, the market for public transit continues to erode in the face of ongoing suburbanization and increased auto use. By 1990 public transit comprised only 2 percent of all trips and just over 1 percent of suburban trips. At the same time, miles of travel in private vehicles increased by 40 percent. In his analysis of National Personal Transportation Survey data, Alan Pisarski found the largest declines in transit use during the 1980s were in transit’s traditionally strong markets: among women and low-income riders, and in the transit-rich Northeast.
In addition to shrinking the natural markets for transit, increasing suburbanization of metropolitan areas has spawned dozens of new suburban transit systems that compete with larger, central city transit systems for scarce subsidy dollars. Further, a variety of external mandates—“Buy America” requirements, drug and alcohol testing, and, especially, the Americans with Disabilities Act (ADA)—have combined to increase costs. Among the many ADA requirements are rules requiring para-transit services for passengers in fixed-route service areas who are unable to use the system. While such services perform an important social function, they do so at a relatively high cost— and expansion of such services reduces the cost-effectiveness of public transit. In 1994, operating cost per passenger for demand-responsive service nationwide was $13.16, compared to just $1.98 for fixed-route bus service. The effect of eroding transit markets, increasing funding competition, and expanding service mandates have combined to diminish service productivity (passengers per revenue-vehicle hour) and force service cutbacks on the ten largest systems.
Although the economy recovered during the mid-1990s and transit patronage stabilized nationally, ridership has not returned to pre-recession levels.
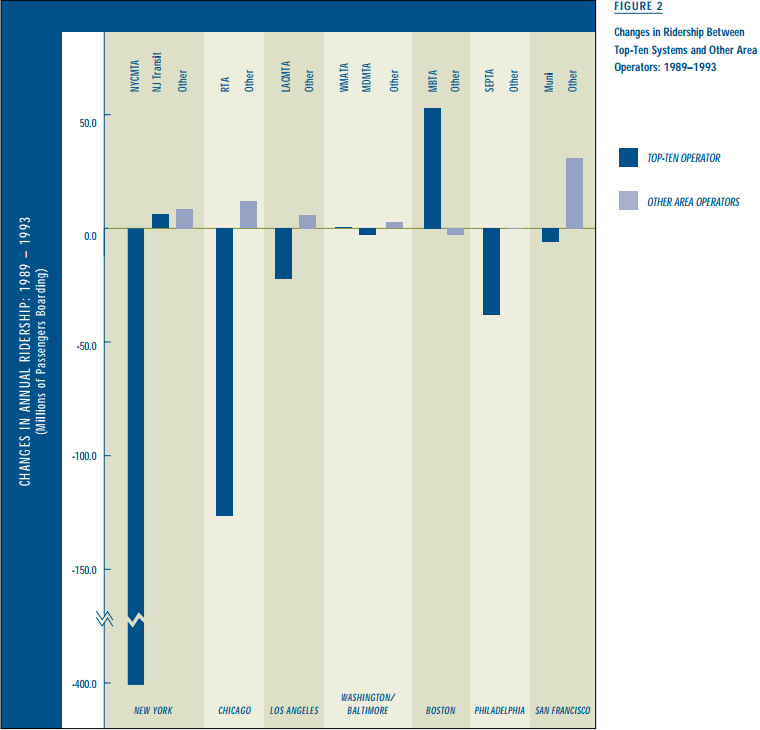
While the nation’s ten largest transit systems collectively cut over 600,000 annual hours of service between 1989 and 1993, the ridership losses on these systems are not simply the result of service cuts. While the two largest transit systems (in New York City and Chicago) cut over 2.8 million annual hours of service between 1989 and 1993, six of the “Top Ten” systems actually increased service during this period, three (in Boston, New Jersey, and Washington, DC) by over 10 percent. In contrast to the collective service cuts on the ten largest systems, however, transit service nationwide increased by 11.2 million annual hours between 1989 and 1993.
In contrast to the collective service cuts and ridership losses on the ten largest transit systems, other transit systems operating in the same metropolitan areas added 1.7 million hours of service between 1989 and 1993, and increased ridership by nearly 7 percent (see Figure 2).
Shifts In Income And Subsidies
From one perspective, this overall shift in service to smaller, suburban transit operators increased cost efficiency and permitted more hours of transit service. That’s because the largest transit systems tend to be much more expensive to operate than smaller ones. In 1993, the median cost per revenue-service-hour in the Top Ten was $96.59, while other operators serving the same metropolitan areas averaged only $55.11 per service hour. But while the smaller, more suburban transit operators tend to produce transit service more cheaply, they attract far fewer riders. Transit subsidies in the suburbs buy more service but fewer passengers—and less fare revenue.
Thus the vast majority of transit systems require larger and larger taxpayer subsidies over time. In some places, the growth in subsidies has been dramatic. In Los Angeles, fares and other direct income from advertising and retail concessions dropped by 25 percent as a share of total MTA revenues between 1989 and 1993, while Baltimore suffered an 18 percent drop. Most of this declining share of fare revenue has been made up through increased taxpayer subsidies. In Los Angeles, a one-cent addition in the local sales tax has been the principal replacement source for lost operating revenues, while Baltimore has turned to increased state financing. As a result the subsidy-per-revenue- hour of service on Los Angeles MTA buses and trains increased by over 50 percent between 1989 and 1993; in Baltimore the increase was 83 percent.
Faced with rising costs and flat or declining fare revenues, many transit operators, such as those in Los Angeles and Baltimore, have turned to local and state revenues to make up the shortfall. Federal operating support for transit has declined since 1980, a trend that’s probably here to stay. Federal support of transit operations is based on distribution formulas favoring smaller metropolitan areas that have proportionally fewer transit users. Passengers in small urban areas enjoy federal operating subsidies at an average of $0.44 per ride, over four times the per-passenger operating subsidy for large urban areas.
State operating funds for transit have substantially increased over the past five years in response to losses in federal subsidies. However, as with federal subsidies, state funding is subject to policies and distribution formulas that may not favor the largest operators. For example, California’s Transportation Development Act (TDA) follows a strict return-to-source allocation formula. The rule makes for greater subsidies for less heavily patronized suburban systems compared to those for larger urban systems operating in densely developed areas with higher levels of transit use.
Declining Service Productivity
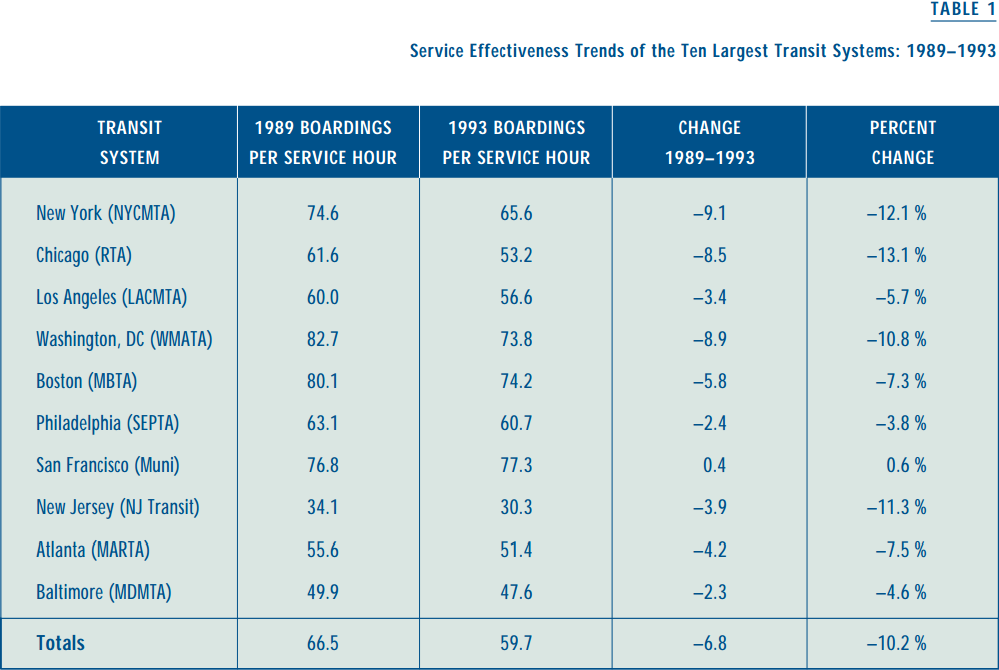
When forced to cut service, transit operators typically seek to eliminate the poorest performing runs and routes to keep as many riders as possible. The net effect of such cuts should be to increase productivity (passengers per hour) on the service that remains. But between 1989 and 1993, service cuts in the Top Ten systems came along with a drop in service productivity. Although declining transit productivity is a nationwide phenomenon, the overall decline of 10.2 percent among the Top Ten systems is twice the rate for other systems in the US (Table 1).
Stabilization But Not Recovery
Plummeting ridership on the nation’s ten largest transit systems during the 1989–1993 economic recession stemmed from a modest cut in service and deteriorating service productivity. These ridership losses, in turn, swamped the modest increases in ridership on the 5,000-plus other systems in the US. This loss of transit ridership during the economic recession of the early 1990s is only the second, multi-year decline since the advent of federal operating support in the early 1970s (the other occurred during the economic recession a decade earlier)—and it marks a departure from nearly two decades of modest sustained ridership growth.
Trends are not uniformly bleak. During the 1989–1993 period examined here, ridership increased significantly on Boston’s largest system. Ridership was stable on both New Jersey Transit and WMATA in the nation’s capital (although passenger boardings per service hour declined an average of 10 percent on these three systems). Recent data indicate that ridership on NYMTA buses and trains has crept up after a precipitous twenty-year decline. But such laudable efforts to stem the tide of ridership losses in New York City most likely don’t represent a turnaround in big city transit. Regarding New York, Brendan Read noted: “Unfortunately, the efforts by the MTA may resemble those of Sisyphus, who pushed a mammoth rock only to have it roll back down again.”
Unfortunately the ten largest US transit systems, operating in cities with population and employment densities sufficient to support significant transit ridership, lost 537 million annual riders during the economic recession of 1989–1993. In the first two post-recession years, the ten largest systems collectively recovered fewer than 24 million passengers. While transit ridership nationally has stabilized since the recession, transit productivity has continued to erode, suggesting that substantial increases in subsidies or substantial reductions in operating costs, or both, are needed to maintain transit ridership.
Absent radical changes to the array of public policies supporting automobile use and automobile-oriented development, it appears unlikely that the devastating ridership losses of the early 1990s will be fully regained. In particular, the continued suburbanization of population, employment, and electoral power does not bode well for the largest central-city transit systems in their competition with automobiles for passengers or with expanding suburban transit systems for scarce transit subsidy dollars. Quite clearly, the “Top-Ten Countdown” between 1989 and 1993 was a devastating and enduring blow to public transit in the US.
Further Readings
Gomez-Ibanez, Jose, “Big-City Transit Ridership, Deficits, and Politics: Avoiding Reality in Boston,” Journal of the American Planning Association, vol. 62, no. 1, pp. 30–50, 1996.
Pisarski, Alan, Travel Behavior Issues in the 90s, Office of Highway InformationManagement (Landsdowne, VA: Eno Transportation Foundation, Inc., 1997).
Read, Brendan, “New York Ridership Expands: As Transit Budget Tightens,” Metro Magazine, May/June, pp. 16-20, 1995.
Taylor, Brian D., “Unjust Equity: An Examination of California’s Transportation Development Act,” Transportation Research Record, vol. 1297, pp. 85–92, 1991.
Taylor, Brian D. and William S. McCullough, “An Examination of Recent Ridership Declines Among the Largest U.S. Transit Systems,” Institute of Transportation Studies, UCLA, Working Paper, 1998.
Transit Cooperative Research Program, Funding Strategies for Public Transportation, vol. 1, final report (Washington, DC: Transportation Research Board, 1998).