You’ll no doubt be surprised to read that transit buses get rear-ended more often than passenger cars do. You’re surprised, I suspect, because buses are so large and obvious. Who could fail to see that bulky bus? Who could fail to know it moves slowly and stops often?
These collisions are a tremendous waste of resources. Crashes injure both bus patrons and passengers in other vehicles, damage expensive equipment, cause delays and service disruptions, worsen traffic congestion, lessen acceptance of transit as a travel choice, and they’re expensive. A 1997 estimate found that each crash cost $54,000.
Plus, we find, these crashes are largely preventable.
Invisible Buses
There are presently about 45,000 transit buses operating in this country. Each suffers a crash of some sort about once per year. Veridian, a consulting firm working on a wide-ranging study with the Ann Arbor Transit Authority, reviewed over 300,000 bus crashes during the five years ending in 1998. That review uncovered glaring indications that those bulky vehicles must have been largely invisible to oncoming drivers when they ran into the buses’ rear ends. Here’s what they found:
Rear-end collisions are the most common bus crashes (37 percent)
The second most common occur when a vehicle turns into the bus’s path (22 percent)
Two-thirds occur on straight roads when buses are stopped (66 percent)
An additional fourth occur when buses are moving or slowing (25 percent)
More occur in urban settings than elsewhere (81 percent)
Over half occur on undivided roads (54 percent), nearly half on two-lane roads (42 percent)
A rather large majority occur between (not at or in) intersections (62 percent)
Over half occur on level roads (60 percent); most on straight roads (89 percent)
Over half occur where the speed limit is 30 mph or higher (71 percent)
Most striking vehicles were going straight, neither turning nor changing lanes (82 percent)
Most of those vehicles exhibited no mechanical defect (e.g., brake failure) (92 percent)
Most rear-end collisions occur during daylight hours (86 percent)
Three-fourths occur under benign weather conditions (neither fog, rain, snow, nor dust) (77 percent)
Bus drivers took no corrective action in most cases (86 percent)
 These facts—especially that the bus was usually stopped—strongly suggest it’s the oncoming drivers who need help, not the bus drivers. We recently joined the Ann Arbor study to help find a way of alerting drivers when they are either too close to a bus or approaching too rapidly. Because we’re unable to intervene in the bus driver’s activity, the project focused instead on the bus itself. Suppose the bus could perceive the vehicle behind it; and, once perceived, suppose the bus could deliver a message to the oncoming driver in a form that might be quickly and clearly received and acted on.
Our task in this project was to devise such a signal to be attached to the back of the bus. We were told there would be a radar system, fitted to the rear of the bus. It surveys traffic behind the bus and reports its location and the rate at which the gap between the bus and any approaching vehicles is shrinking. When the combination of these variables is in a critical zone, a computer programmed to interpret the radar message generates a warning signal. This system requires no intervention by the bus driver.
Our question then: What should this warning be?
The Speed Of Light
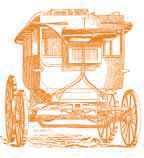
We began with a signal provided by our sponsor. It was a rather simple device, rectangular in shape (150 cm by 8 cm) and designed to be fixed to the rear end of the bus at about the eye level of an oncoming driver. When lit, all eight identical units, each containing a pair of automotive halogen bulbs and an amber lens, would be seen as a single bright amber bar (hence we called it a “light bar”). The choice of shape was dictated by convention as well as the availability of components. The choice of color was constrained by the prohibition against using green (wrong message), red (for brake lights only), white (for backing and headlights, not for signaling), and blue (restricted to emergency vehicles). Our task was to work with the given design of this device to produce a signal that would be seen quickly.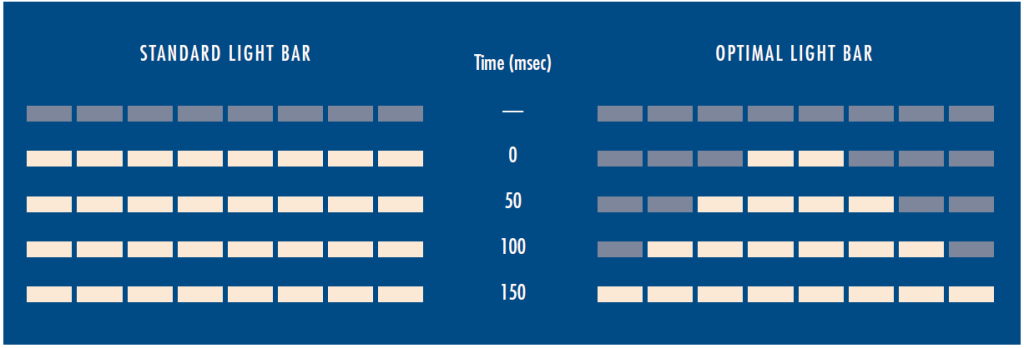
Our first step was to replace the sluggish incandescent lamps with fast-igniting light-emitting diodes (LEDs). Incandescents turn on quite slowly: 1 ⁄25 of a second elapses before these bulbs even begin to glow, then nearly 1⁄4 of a second passes before they are fully lit. We made some simple measurements of how long it takes humans to see this sluggish turn-on compared to instantaneous turn-on of LEDs and found the delay is about 75 milliseconds. The slow turn-on of the incandescent lamp is thus quite a serious problem, since it requires about 75 thousandths of a second more than an LED for observers to actually see that the lamp is lit. This may not seem like much, but it is significant; we’ll come back to this number again below.
The only other degree of freedom we had in our design was the ignition pattern of the light bar’s eight elements. For this we relied on our understanding of the human visual nervous system, mentioned in these pages in the past (ACCESS No. 14, Spring 1999). The visual nervous system comprises two separate, parallel pathways. One of these is relatively insensitive to small changes in light level, but sensitive to fine detail and color. The other is highly sensitive to light change, time change, and motion. We judged it more advantageous—and easier—to excite the latter than the former.
The Tortoise And The Hare
We conducted two experiments in the laboratory. For the “hare” test we operated the light bar in its native mode, in which all eight elements turned on together and immediately. For the “tortoise” test we lit the elements in a unique sequential pattern. We started with the innermost pair of elements, then ignited the next most central pair 1 ⁄20 of a second later. We continued this sequence, waiting 1 ⁄20 of a second between pairs, until the entire light bar was ablaze.
Human observers—our willing students and some cooperative staff members—judged the race. The task of each was to indicate, by pushing a button, the moment he or she saw the light bar turn on. We started a digital timer capable of millisecond accuracy when the first element came on, then stopped it when the observer pushed the button.
The light bar was placed in a position just above the bumper of a nearly life-size photo of a bus’s rear end. We tried a number of different situations, 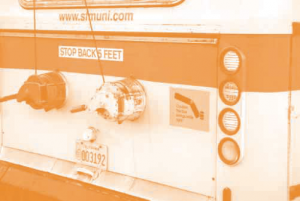 simulating daytime and night viewing. The light bar was seen up close (4.6m distant) and farther way (45.7m). It was operated at full intensity and at five percent intensity to simulate poor viewing conditions, such as dirt-covered lenses. We encouraged observers to look just above it and to be ready for it, or to look at random anywhere on the picture of the bus to simulate what real drivers might be doing behind a real bus. To detect how quickly such signals can be seen, we made repeated measurements, usually 25 repetitions for a given observer and a given condition.
Here’s what we found. When we turned on the light bar’s individual units sequentially, the bar was seen more quickly than when we lit up the whole bar instantaneously. Under daytime conditions, the average reaction time for the instantaneous lighting, the “hare” test, was 0.269 second. That’s fairly fast. But the improved, sequentially activated light bar, “the tortoise,” which turned on 0.15 second more slowly, was seen about ten percent more quickly, in an average of 0.237 second.
We looked more closely at our data, and discovered something interesting: averages fail to convey the whole story. Consider the data cited above as an example. In that test, we recorded 150 reaction times for our six observers. The average, as I noted, was about ten percent better for the sequential light bar. But of the 150 tests, more than half of the reaction times were under 1 ⁄4 second for the sequential light bar, but less than half were that short for the instantaneous one. In contrast, about six percent took longer than 2 ⁄5 second for the standard, but under one percent took that long for the optimized bar. In sum, the sequential light bar “converts” some very long reaction times into very short ones.
The time saved seems small but is highly consequential, given the speeds at which cars hit buses. Every 1 ⁄10 second saved is 4.4 feet additional stopping room for a car traveling at 30 mph. That is about what our design can do. Adding the 75 thousandths of a second saved by converting to LEDs to the 32 thousandths saved by turning on the light bar sequentially gives just over 1 ⁄10 of a second average improvement—a blink of time that could be enough to prevent a crash.
Further Readings
Intelligent Vehicle Initiative Needs Assessment. FTA-TRI-11-99-33 DOT-VNTSC. Federal Transit Administration, US Department of Transportation. November 1999.
Robert Shapley, “Visual sensitivity and parallel retinocortical channels,” Annual Review of Psychology, no. 41, pp. 635-658, 1990.