Last spring’s Senate hearings on Corporate Average Fuel Economy standards made much about the increased risk Americans would face if forced to give up their SUVs for vehicles that weigh less. To find out whether that risk is real, and whether SUVs really are safer than cars, as some have alleged, we analyzed highway fatality data. Our findings came as a surprise.
 We focused on “driver death rates,” a concept of risk developed by the Insurance Institute for Highway Safety. However, our analysis differs from the Institute’s in two important ways. First, we examine risk not only to drivers of vehicles of a particular type, but also to drivers of vehicles that crash with that vehicle type. Second, we limit our study to recent models having sold enough vehicles to permit statistical analysis. By studying risks associated with vehicle models built between 1995 and 1999, we focus on vehicles with up-to-date safety designs and constraint technologies. Seat belts and airbags are improved and more widely used; vehicle design is more sophisticated; and the standardized head-on crash test and regulations have hastened design improvements. Manufacturers continue to make additional improvements to vehicles.
Two Types Of Risk
We consider nine categories of cars and light trucks, classed according to size and weight. Figure 1 shows two types of risk. First is the risk to drivers of each vehicle type, shown on the horizontal axis (we’re calling these primary drivers); and second is the risk to drivers of other vehicles that crash with that type (the vertical axis). We define “risk” as driver deaths per year per million vehicles sold. Both estimates of risk are calculated for vehicles from model years 1995 to 1999 and from the number of deaths in those years. The other vehicle may be of any model year or type (including motorcycles and heavy-duty trucks and buses); we have not broken down the other vehicle numbers according to type or model. The risk to primary drivers includes driver fatalities from all types of collisions, whether with another vehicle, a fixed object, a pedestrian, or a cyclist, as well as noncollisions such as rollovers. To avoid biases associated with varying numbers of passengers per vehicle, we consider driver deaths only.
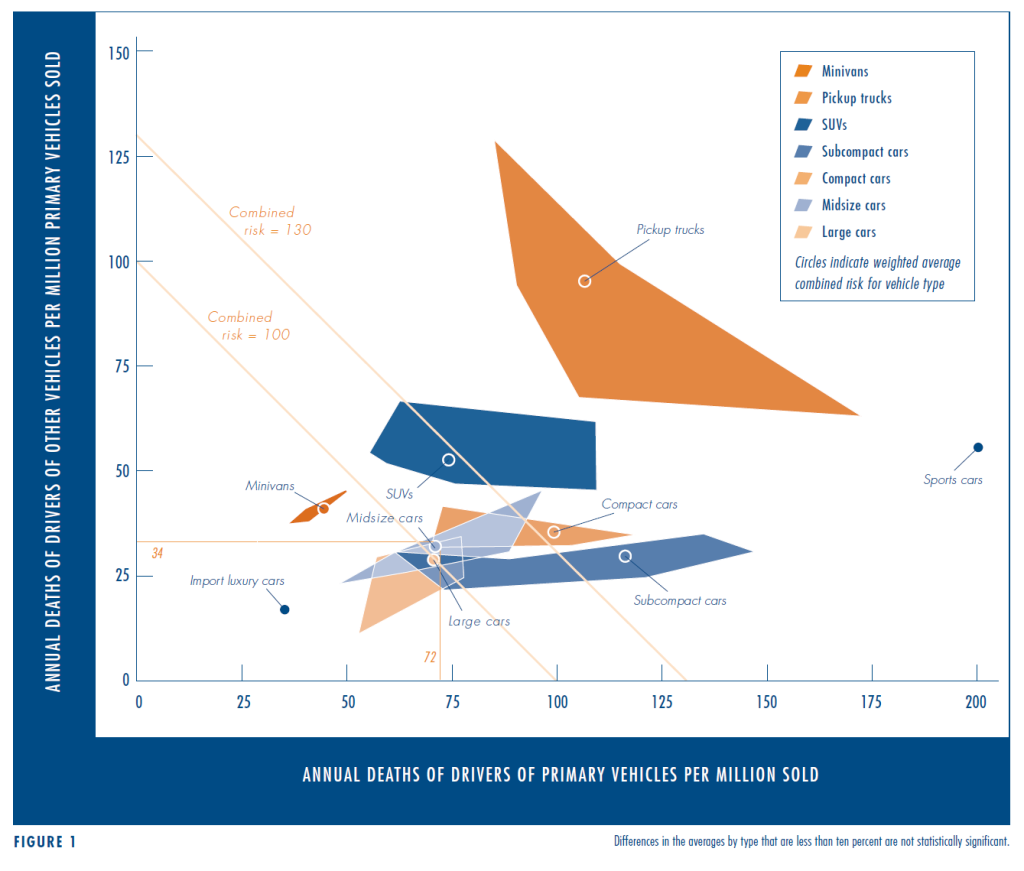 The small circles in Figure 1 show the two weighted average risks for popular models of each vehicle type. For example, for the average midsize car, the risk to drivers is 72 deaths per year per million cars, while the risk to drivers of vehicles they collide with is 34 deaths per million cars. The shapes around each circle represent the ranges in each risk for individual models: The horizontal axis shows that the risk to drivers of, for example, midsize cars ranges from 47 deaths per year per million cars for the lowest risk model (Camry) to 97 for the highest risk model (Lumina). The vertical axis shows that the risk to drivers that collide with midsize cars ranges from 24 (Camry) to 47 (Lumina) deaths per million midsize cars.
We define the “combined risk” of each vehicle type and model as the sum of the “risk to primary drivers” plus the “risk to drivers of other vehicles.” Diagonal lines in Figure 1 illustrate combined risks of 100, which roughly corresponds to that of the average large car, and 130, which roughly corresponds to that of the average SUV. These lines are diagonal because they combine the risk to driver (x-axis) and risk to driver of the other vehicle (y-axis).
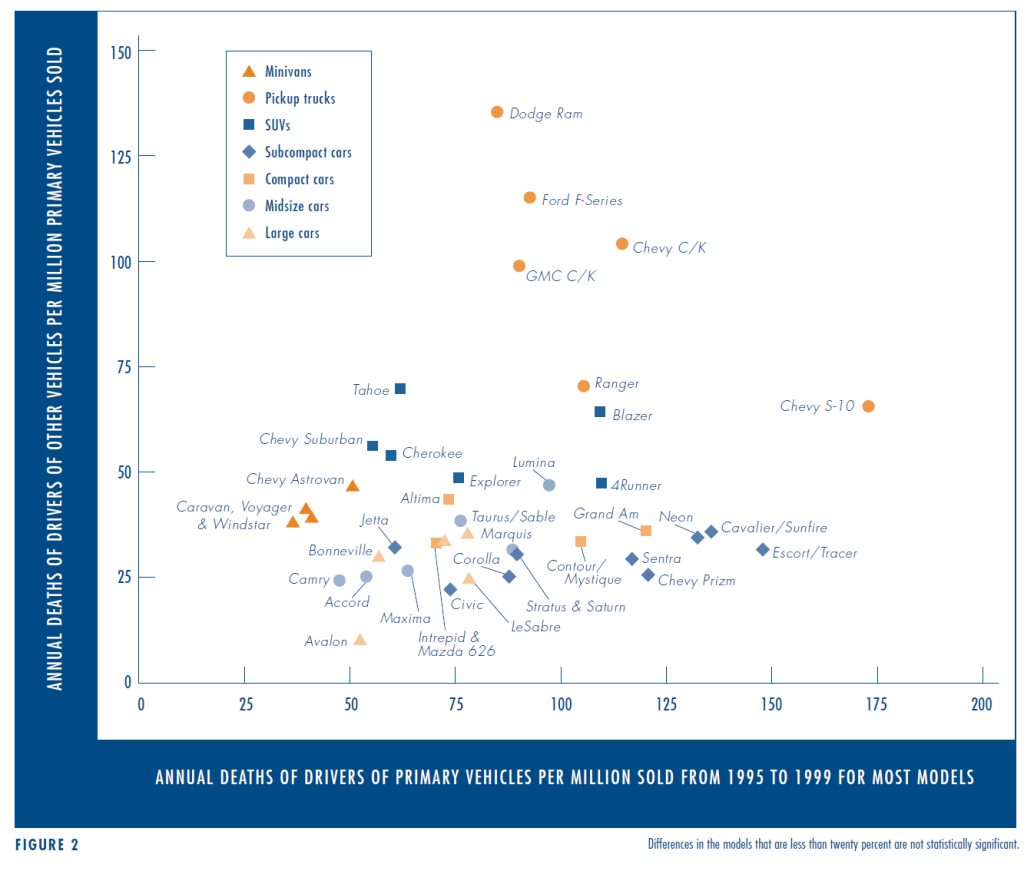 Figure 2 shows the two risks for individual vehicle models (the most popular ones). The risk to drivers of the most popular subcompact cars varies by more than a factor of two for individual models, e.g. from 60 for Jetta to 148 for Escort. Similarly, the risk to drivers of other vehicles for the most popular pickups ranges by about two times among individual models, from 65 for Chevy S-10 to 136 for Ram.
Figures 1 and 2 suggest some important relations between risk and vehicle type. Keep in mind that characteristics of the drivers of certain vehicle types and models and of the environments in which the vehicles are driven may strongly affect their risk. We emphasize that the risks estimated here are not necessarily inherent in the vehicle designs, but include how and where the vehicles have been driven.
Midsize and Large Cars and SUVs. The risk to drivers of average midsize and large cars is about the same as for the average SUV. The risks differ in their makeup, with a higher fraction of fatalities in SUVs from rollovers. Similarly, the risk to drivers of the safest midsize and large car models (Avalon, Camry, and Accord) is about the same as for the safest SUVs (Suburban, Cherokee, and Tahoe). However, the average SUV poses nearly twice the risk to drivers of other vehicles as do the average midsize and large cars. The net result is that the combined risk of the average SUV (129) is about 25 to 30 percent higher than that of the average midsize (105) or large car (100).
Subcompact and Compact Cars and SUVs. The combined risk of the average subcompact (141) or compact (136) is only slightly higher than that for the average SUV (129). However, the combined risk of the safest subcompact and compact models (VW Jetta and Honda Civic) is less than that of SUVs.
The risk to drivers of the safest subcompact and compact models (Jetta, Civic, Saturn, and Corolla; Mazda 626 and Altima) is about the same as that of the average SUV (74). A critical aspect of the dispute regarding the relative danger to occupants of light or small cars is the very wide range in the risk to drivers of subcompacts. At one end are the low-risk Jetta and Civic mod- els, but at roughly twice their risk are the Cavalier, Escort, and Neon models. The latter three inexpensive domestic models are responsible for greatly raising the average risk to drivers of sub-compact cars. Does the safety record of those three models prove that light cars in general are unsafe? We have presented evidence that there is no such simple rule. Might it instead suggest that relatively inexpensive cars tend to be unsafe? The recent National Academy majority report on fuel economy argues that the low weight of cars with high fuel economy has resulted in many excess deaths. That inference is unfounded.
Figure 1 shows that the risk associated with lightweight cars has a very wide range. In other words, weight does not determine the risk. New vehicle designs that pay close attention to safety considerations have helped make many cars in the subcompact- to-midsize range as safe as large cars and SUVs.
 Minivans. Of all major vehicle types, minivans have the lowest primary risk and the lowest combined risk (excluding luxury imports). This happy outcome may reflect their drivers’ special care, for they are often used to transport children. But it also reflects minivan design, for most are built on car platforms, rather than on pickup-truck chassis. That basic design feature probably reduces the risk to their drivers, and certainly reduces the risk to other drivers. For example, the car-like body of the Grand Cherokee, an SUV, presents about twenty percent lower risk to its drivers than does the truck-based Cherokee (a suggestive result, although not statistically significant).
Pickup Trucks. Pickup trucks are riskier than any other type of vehicle, excluding sports cars. Their average combined risk is more than twice that for large or midsize cars. Light trucks, especially pickups and to a lesser extent SUVs, are responsible for the deaths of many people in other vehicles, as shown by the vertical axis in Figure 1. This result mirrors earlier findings by Hans Joksch, who examined the outcomes of two-vehicle crashes as reported to the police. He found that there are twice as many driver deaths in pickup-car crashes as in car-car crashes and 1.8 as many deaths in SUV-car crashes as in car-car crashes. To a substantial degree, the risks that light trucks impose on other drivers are associated with their basic design. The chassis of pickups and most SUVs are more rigid than those of cars, and the bumpers are higher. Moreover, these deaths to others occur largely in urban and suburban settings, where pickups are rarely used to carry cargo.
The risk to drivers of pickups is a distinct issue. That risk is not significantly different from that of average compact and sub- compact cars. The pickup risk is partly due to trucks driven in rural areas, where conditions are relatively less safe owing to high speeds on poorly designed and policed roads, as well as the tendency of some of these vehicles to roll over.
Import Luxury and Sports Cars. Import luxury cars have the lowest combined risk, while sports cars have the highest combined risk of all vehicle types we studied. It is likely that much of the high risk of sports cars is associated with aggressive driving.
Effect Of Driver And Environment On Risk
 It is extremely difficult to determine the inherent safety of a vehicle type or model, because driver characteristics and behavior (speed, use of seat belts, aggressive lane-changing, etc.) and environmental factors (such as road conditions) cannot be adequately accounted for. Some car models, such as most sports cars, attract relatively aggressive drivers, and their aggression increases fatalities associated with those models, independent of their design. The Chevy Corvette illustrates that both vehicle design and driver variables are important. Like drivers of other sports cars, Corvette drivers face a higher risk (275) than drivers of other types of cars (way off scale to the right of Figure 2). But, although Corvettes are driven dangerously, the risk to drivers of vehicles that collide with Corvettes (25) is lower than that of the average midsize car (34, in Figure 1). The low- slung design and plastic body of the Corvette probably account for its low risk to other drivers.
To explore some of the effects of driver behavior, we also looked at driver age and gender in fatal crashes. We found no evidence that either factor accounts for the differences in risk discussed here. In the future, we plan to explore the effects of other driver characteristics and environmental variables in an attempt to refine our analysis.
Conclusions
Opponents of strengthened fuel-economy standards claim higher standards will result in more traffic fatalities. If the new fleet were to be like the recent average light vehicle, traffic deaths probably would increase, as shown by the increase in risks to drivers as one goes from the average midsize and large cars to the average compact and subcompact cars, as shown in Figure 1. That simple conclusion mirrors the statistical analyses emphasized in the National Academy fuel-economy study. But that simple conclusion is probably wrong.
Many existing small-car models, built primarily by foreign manufacturers, are as safe as their larger and heavier (and less efficient) counterparts, as shown in Figure 2. There is reason to expect that manufacturers can further improve the safety of vehicles by making them lighter without making them smaller, given such technological advances as smaller high-tech engines and transmissions, unibody or space-frame structures replacing the body-on-frame of most SUVs and pickup trucks, and increased use of lightweight materials. While it is reasonable to expect that increased fuel economy standards would make for lighter vehicles, we have shown that reduced vehicle weight does not imply reduced safety.
Acknowledgment: Thanks to John DeCicco, David Greene, and Therese Langer for valuable comments on the manuscript, and to Kenneth Campbell, Charlie Compton, Hans Joksch, Carl Nash, and Matt Reed for trying to educate us about traffic safety analysis. In spite of this help, the responsibility for all opinions and any errors rests with the authors. We thank The Energy Foundation for supporting this work.
Further Readings
H.C. Gabler and William T. Hollowell. The Aggressivity of Light Trucks and Vans in Traffic Crashes. SAE Technical Paper Series 980908.Warrendale, Penn.: Society of Automotive Engineers. 1998.
William T. Hollowell and H.C. Gabler. “NHTSA’s Vehicle Aggressivity and Compatibility Research Program,” in Proceedings of the Fifteenth International Technical Conference on the Enhanced Safety of Vehicles, Volume 1, pp. 576–592. Paper No. 96-S4-O-01. Washington, D.C.: US Department of Transportation, National Highway Traffic Safety Administration. 1996.
Insurance Institute for Highway Safety. Status Report Special Issue: Driver Death Rates. Vol. 35, no. 7, August 19, 2000.
Hans Joksch. Vehicle Aggressivity: Fleet Characterization Using Traffic Collision Data. NHTSA DOT HS 808 679. Washington, D.C.: US Department of Transportation, National Highway Traffic Safety Administration. 1998.
National Academy, Effectiveness and Impact of Corporate Average Fuel Economy (CAFE) Standards, National Research Council. 2001