The era of social regulation began in the late 1960s. At first the focus was on safety and pollution, and later on energy use. Motor vehicles were the first and most prominent target. Now, forty years later, social regulation is firmly entrenched.
Regulators propose increasingly stringent technology-forcing rules on vehicles, expecting automakers to find a way to adhere to them. Automakers invariably resist, asserting economic hardship. Parts suppliers, trade groups, labor unions, consumers, environmentalists, and others intervene on one side or the other in a dance that proceeds through legislatures, courts, and the public arena.
What have been the effects of these social regulations? Have individual companies or entire industries suffered economic hardship? Have consumers been disadvantaged?
Remarkably, few efforts have been made to answer these questions. A new cohort of analysts is trying to specify costs, benefits, and risks of new regulations. President George W. Bush’s controversial appointment of Professor John Graham, a risk-analysis expert from Harvard, to the Office of Management and Budget is accelerating this new scrutiny. Even in the most sophisticated analyses, though, rarely are long-term or secondary impacts considered.
California is now expanding the regulatory arena with the US’s first-ever rules to reduce greenhouse gas emissions from vehicles. Sensitive to criticism about economic impacts of regulations, the California Air Resources Board asked a group of us at UC Davis to analyze historical effects of previous social regulations as a means of guiding it along this new regulatory path.
The challenge was more daunting than we initially imagined. We soon found that little is known about the effects of previous regulations—even direct cost impacts. What we do know and can state with confidence is that vehicle emissions and safety have improved dramatically—and that government regulations have played a central role in these improvements. Today’s vehicles emit 90 to 99 percent less pollution than pre-control vehicles of the 1960s and are far safer, thanks to government-mandated changes.
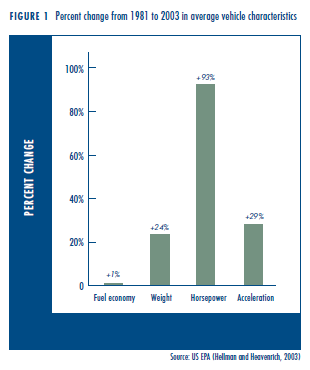
Fuel consumption improvements have been more modest and the role of government more controversial. Fuel economy standards adopted in 1975 required automakers to increase fuel economy in cars from unregulated rates of about 15 mpg to 18 mpg in 1978, and then to 27.5 mpg by 1985 (with a separate set of less stringent standards applied to pickups, minivans, and SUVs). Automakers met these initially aggressive standards through the early 1980s, responding to steep increases in fuel economy standards and fuel prices. Since then overall fuel economy of cars and light trucks has not improved at all— though not for lack of technical improvements. Tremendous improvements were made in engine efficiency and lightweight materials during these last twenty years, but the efficiency improvements were not used to improve fuel economy. Instead, they were used to increase horsepower and size, improve acceleration, and add energy-consuming accessories such as all-wheel drive and air conditioning (see Figure 1). If performance and size had been held constant from 1985 to 2001, fuel economy would have improved over twenty percent. Instead it improved not at all.
An important first observation is that the automotive industry is highly innovative, perhaps more than ever, and that government rules strongly influence and direct those innovations.
But how those innovations are used is part of a more complex story related to market dynamics, consumer behavior, and company positioning.
Therein lies our challenge: how to untangle and understand the effects of government regulations on automakers and consumers. We have made an effort to do so.
Our principal finding, elaborated below, is that the costs resulting from efforts to improve safety and emissions are significant, but represent only a modest part of overall vehicle cost increases. Further, vehicle regulations had little discernible effect on industry performance and activities. The cost increases have been largely accommodated within normal business and market planning processes of companies.
Are Costs Of Regulation Large?
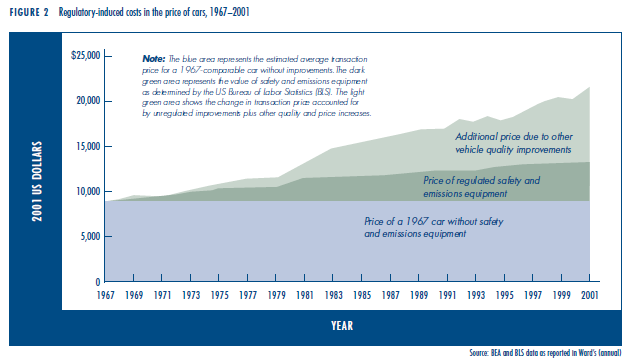 Government regulations to improve safety and reduce air pollutant emissions and oil use have indeed added significant cost to vehicles. Our best estimate is that regulatory requirements caused one-fifth to one-third of vehicle price increases between 1967 and 2001 (see Figure 2)—accounting for one- eighth to one-fifth of the total price of new vehicles. Other changes—improvements in reliability, durability, “fit-and-finish” quality, and power, along with the addition of many new accessories—incurred much greater costs and were responsible for a larger proportion of increased vehicle prices.
These cost estimates are based on two sets of government data: annual estimates of the cost of “quality improvements” to vehicles by the US Bureau of Labor Statistics (BLS), and vehicle price estimates by the US Bureau of Economic Affairs (BEA). Both sets of data, especially BLS data on costs, are subject to large uncertainty. Better cost data are not available because companies treat costs as confidential and the complexity of vehicles makes it difficult for those outside the companies to estimate costs of components and subsystems.
The sales-weighted average price of vehicles sold in 1967 was estimated to be $3,200 in current dollars, including a very tiny amount (about $11) for regulated quality improvements (for safety and emissions). The price of that car, adjusted for inflation, would be $9,120 in 2001 dollars, as indicated in Figure 2. But the actual 2001 price (from BEA) was $21,600. Hence, quality improvements and other cost factors between 1967 and 2001 account for $12,480 of the price of the 2001 car.
Separately, Ward’s Automotive Yearbook, using BEA and BLS data, estimates the total price of improvements due to regulations for 2001 cars to be $4,020. Dividing $4,020 by $12,480 provides the estimate that regulations accounted for about one-third of the price increase between 1967 and 2001.
 We believe this estimate of regulatory costs is high. Based on our detailed analyses of emission costs and a review of safety costs, summarized below, we believe the cost of emissions and safety regulations to be considerably less than $4,020 per vehicle, closer to $2,500 (about $1,000 for emissions and less than $1,500 for safety). If it is $2,500, regulations would account for one-fifth of price increases and about one-eighth of the total vehicle price. Moreover, the 1967 car would be entirely unacceptable in today’s world, regardless of regulations. Some environmental, fuel economy, and safety improvements would have been made anyway, with corresponding costs. In fact, as noted below, demand for safety now far outpaces regulatory requirements.
In any case, virtually all analyses of benefits resulting from emissions and safety improvements—measured as health impacts of air pollutant emissions and the value of lives saved, injuries avoided, and property damage averted—find that the benefits are worth much more than $2,500, or even $4,000.
A Closer Look At Emission Control Costs
To test the credibility of these aggregate regulatory cost estimates, and to understand better the nature of these costs, we conducted a detailed analysis of emission control costs. We found that emission control costs per vehicle peaked in the early 1980s and only now are starting to reach those earlier cost levels—but with far greater effectiveness in reducing emissions.
These cost estimates are subject to considerable uncertainty. There are no accepted methods for determining how to allocate research and development and factory retooling expenditures, for instance. Consider also that some components, such as electronic fuel injection with microprocessors, were developed initially to reduce emissions, but are now used to improve performance and energy efficiency as well as emissions. Moreover, costs vary depending on vehicle weight, engine design, and engine calibration, as well as by manufacturer. Plus, cost data are closely guarded by companies.
A number of analysts have made cost estimates of emission control systems, each using a different method (Figure 3). Each study found that the 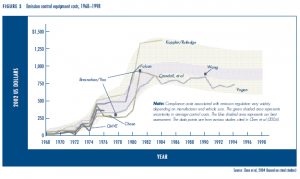 cost per vehicle for emission control jumped dramatically, first in 1975, when oxidation catalysts were introduced to meet tightened hydrocarbon and carbon monoxide standards; and again in 1981, this time when three-way catalysts and electronic controls were introduced to meet more stringent nitrogen oxide standards. Costs subsided into the early 1990s, as continuing improvements were made in design and manufacturing.
New standards adopted in 1990 by California and the US EPA required further emission reductions and a new set of technological innovations, reversing nearly a decade of declining per-vehicle costs. The net result of this intermittent tightening of emission standards is that today’s vehicles are about $1,000 more expensive (in retail prices) than they would be if emissions were not controlled. This per-vehicle cost increment is roughly the same as in the early 1980s when emission standards were far less stringent.
A Closer Look At Safety Regulations and Costs
Safety regulations also led to major changes in vehicles. Consider airbags, the most costly change. After years of deliberation, a passive restraint standard was adopted in 1984, requiring that all new 1990 cars be equipped with airbags or an equally effective technology. Automakers once again resisted and won a series of reprieves until 1991. Legislation was passed in that year effectively mandating the use of dual airbags on all vehicles sold in the US beginning with 1998 cars and 1999 light trucks.
 The delays in adopting and enforcing passive restraint rules was principally tied to arguments over airbag costs, with automakers claiming they were onerously high. In the 1970s and early 1980s, cost estimates ranged from $200 to $2,000 (in 2002 dollars) for a vehicle airbag. Varying assumptions about produc- tion volume, cost improvements, and cost allocation methods led to these dramatically different numbers. On average, automaker estimates were about 2.5 times higher than regulator and insurance company estimates. For early airbags sold in low volume, the costs clearly were high. For instance, Ford offered airbags on 1987 and 1988 Tempos and Topazes as an option for $1,233 (2002 dollars), but sold only about 13,000 and reported large financial losses. By 2000, volume was dramatically higher and costs had fallen accordingly. An analysis of a driver-side airbag on a 2000 Ford Taurus found that the cost was about $190 (2002 dollars) at a production volume of 250,000 units. Costs had dropped dramatically from ten years earlier.
Doubling these estimated costs to reflect retail prices and adding in passenger-side airbags and other safety features is unlikely to boost the average safety cost per vehicle much beyond $1000.
Costs had dropped so much that by the early 1990s demand for airbags was outpacing regulatory requirements. Indeed, today’s vehicles are ringed with a variety of additional airbags not required by any government rules. Airbags are now more a response to market demand than to regulatory requirements.
Effect On Industry Structure and Vehicle Markets
 Though regulations imposed considerable costs on automakers, they had little effect on the structure of the industry and did not seem to distort markets in unintended ways. It is true that much has changed in the automotive world in the past few decades. In the 1960s, the three domestic car companies accounted for ninety percent of the market; they now account for sixty percent, and their products have changed significantly. Large station wagons, once ubiquitous on suburban streets, virtually disappeared around 1980; minivans emerged as a new vehicle class soon after; sport utility vehicles increased their share from near zero in the early ’90s to almost twenty percent in 2002; and in the early years of this century, a variety of crossover car-truck models was launched. Regulations seem to have played only a minor role in market shifts.
We found only two instances when regulations altered the mix of vehicles. The first was in the late 1970s and early ’80s. Subcompact and compact cars increased from one-fourth of all cars in 1970 to almost half in 1981. During this period, stringent emission and fuel economy standards came into effect. But at the same time fuel prices more than quadrupled and were expected to continue increasing. Fuel economy standards and large fuel price increases played important synergistic roles in the shift to smaller cars, but we found no evidence that aggressive new emission standards had an effect.
The second time regulations affected vehicle mix was the transition away from cars in the 1980s and ’90s. In 1980, cars accounted for eighty percent of light duty vehicles; by 2001 the share was less than fifty percent, the remainder being light trucks. In 1980 most light trucks were pickups; by 2001, SUVs were the largest light truck category, accounting for twenty percent of all light duty sales. Regulations played some role in this shift, though no rigorous analysis has been conducted. Emission and safety standards were less stringent for light trucks than for cars throughout this period, and perhaps played some role in encouraging a shift to light trucks. But the more important effect was corporate average fuel economy (CAFE) standards. Lenient CAFE standards for light trucks, along with dropping fuel prices, encouraged manufacturers to emphasize minivans in the 1980s and then SUVs in the 1990s.
 In any case, other policy and market factors played an even stronger role in the emergence of light duty trucks. Perhaps the strongest of these other factors was the huge profitability of SUVs in the 1990s. SUVs and large pick-up trucks were far more profitable during this era than cars, an outcome of industry dynamics and protectionist policy (as well as emission, energy, and safety standards). Japanese and European automakers did not have large markets for light trucks in their home countries and thus were slow to enter this market, and protectionist US policies aimed at light truck imports further inhibited them.
These two cases highlight the rare but influential cases where government regulations and related policies have impacted the mix of offerings by automakers. It is instructive to note that in each case, government regulations and policies were operating in unison with changes in fuel prices. During the shift to small cars, fuel prices were soaring. During the shift to light trucks, fuel prices were dropping.
How Industry Responds
Another way to look at regulation-induced costs is from the automaker’s perspective. During the past forty years, three high- cost technologies were introduced as a direct result of regulatory requirements: oxidation catalysts around 1975, three-way catalysts around 1981, and air bags in the 1990s. In none of these cases, nor any other, did automakers experience large cost shocks.
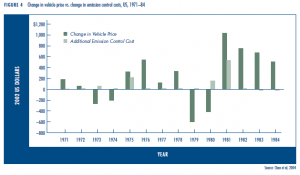
Even during those times when large new emission and safety costs were imposed, as when catalytic converters and air bags were introduced, prices for particular models and even vehicle classes fluctuated both up and down—with little relationship to the new regulation-induced costs (see Figure 4).
Consider, for instance, that in only a few years over the past 35 have increases in emission costs exceeded the change in vehicle price. The response of automakers in 1975 and 1980–’81 is instructive, since this is when emission control costs increased most sharply—$300 to $500 per vehicle in a single year. Figure 4 compares emission costs to vehicle price for these periods. Despite the cost shocks, in both of these time periods, vehicle prices increased considerably more than emission control costs. In general, in most years, the effects of emission standards on vehicle prices cannot be detected. More broadly, we found that the imposition of emissions and safety standards had little effect on vehicle prices.
Prices ↑ Costs
 One of the most important insights we gained in studying industry behavior is that the relationship between pricing and costs is quite complex. Many considerations factor into pricing, in addition to cost. These include image, where some models have exceptional image appeal or provide a halo for the company. While most discussions of regulation impacts have focused on production costs, price is also influenced by legacy costs, market share concerns, and vehicle image. Regulation costs turn out to be a small consideration in this mix of variables, and one faced equally among manufacturers. In 2000, a fully loaded Lincoln Navigator was estimated to earn as much as $15,000 profit per vehicle. A single factory, where the large Ford Expedition and Navigator SUVs were assembled, generated $2.4 billion in aftertax profits in 1998, one third of the company’s entire profit for the year. Similarly, while it cost Ford about the same amount to build their Taurus sedan as their full-sized pickup, they priced the pickup $5000 higher. Sometimes vehicles are priced lower, for instance to lure new buyers to entry-level vehicles in the hope they will become loyal to the brand and later buy more profitable models. High-fuel-economy vehicles are often priced lower as well, to allow the company to sell more high-profit, gas-guzzling luxury cars and still meet CAFE standards.
Legacy costs also affect pricing. The historical US companies—General Motors, Ford, and Chrysler—have many older manufacturing plants, longstanding labor contracts, and large numbers of retirees. They are burdened by the high cost of health insurance and pensions for these many retirees, find it difficult to dispose of outdated facilities, and are limited by labor contracts that require them to continue paying laid-off workers. As a result, these three companies have a large incentive to maintain their market share, and they price their product accordingly—that is, low enough to ensure high sales. The large incentives to buyers of new vehicles—averaging over $3000 in recent years for the Detroit companies—is largely a result of this legacy.
In summary, vehicle pricing is only loosely connected to costs. Automakers are constantly readjusting their vehicle mix, vehicle options, pricing, and financing incentives in response to a variety of market and external conditions. As a general principle, automakers try to recover costs as quickly as possible. But in the end, the cost of complying with regulations appears to play a minor role in the automotive business.
How Consumers Respond
The mantra for automakers is that consumers rule; but little is understood about consumer demand for environmental attributes of vehicles. Surveys show strong citizen support for policy to control air pollution, but how might citizen concern for air pollution evolve into consumer demand for cleaner vehicles? And how might even more abstract environmental and energy concerns—for energy security and climate change—evolve into stronger buyer demand? The conventional wisdom is that consumers have not and will not pay extra for environmental benefits. But the answers are entangled in deeper values related to consumer sovereignty, collective choice behavior, and concern for environmental quality that varies across regions, social groups, and even nations. These values, beliefs, and behaviors are not well understood.
The analytical difficulty is that vehicle buyers have rarely been offered the choice between products differentiated only by levels of performance on environmental measures. During the massive switch to unleaded gasoline in the 1970s, for example, most consumers could not choose which new car or truck to buy based on their “preference” for leaded fuel or the effectiveness and maintenance cost of their car’s emission system. If they preferred leaded gasoline, their only choice was not to buy a new vehicle.
In other cases, distinct environmental attributes, such as low emissions, were simply never marketed, even in the case of cars versus light trucks. For over thirty years, no one—not federal or state governments, not environmental advocacy groups, and certainly not motor vehicle manufacturers—sought to actively market cars and trucks to the public based on the fact that light-duty trucks were allowed to pollute more than cars. (Rules now require all light duty vehicles in California to meet the same standards, with similar national rules to take effect soon.)
Initial evidence from the hybrid vehicle phenomenon suggests that a large proportion of buyers are attracted by the overall package of fuel efficiency, low emissions, and advanced technology. Many hybrid vehicle buyers have zeroed in on the hybrid vehicles without much thought about other options, scarcely considering other vehicles—which explains why so many Prius buyers are willing to wait several months for delivery. They have ignored other comparable vehicles with good gas mileage such as the Toyota Echo and Corolla. In household interviews, these buyers talk as much about social change as they do the vehicle. In their minds, they are buying a stake in a better future and contributing to social change. To what extent might the advent of hybrid vehicles, in many ways the first opportunity to buy an attractive “environmental vehicle,” trigger a shift in buyer behavior and attitudes toward environmental attributes?
Lessons Learned
Regulations to improve vehicle safety and environmental and energy performance do impose additional costs, but these costs are neither permanent nor cumulative. As with any new product or technology, with time and experience engineers learn to design products to consume less space and materials, perform more efficiently, and simplify manufacturing. This has been the experience with semiconductors, computers, cell phones, DVD players, and microwave ovens, as well as catalytic converters and airbags—and will certainly be so with future technologies such as fuel cells.
Negotiations between government agencies and automakers resulted, even in the most extreme cases, in companies being able to accommodate new requirements within the normal routine of business.
Tightened emission and fuel economy standards had an important secondary effect: they motivated development of an impressive array of new and improved technologies with multiple benefits—from electronic controls to sensors and better batteries. Indeed, a strong case can be made that adoption of aggressive emissions, energy, and safety requirements in the 1970s aided the domestic auto industry by forcing it to innovate earlier than it would have otherwise, giving it time to respond to newly competitive foreign car makers.
Conclusions
The era of vehicle regulation is short, but rich in experience. Government regulations in California, the US, and elsewhere have played a large role in the evolution of vehicle technology. Vehicles are now much safer and lower emitting, and they consume less fuel than several decades ago.
Given the large role of regulations and the prominence of public debates over vehicle regulation, it is remarkable how little the automotive industry was disrupted—largely a testament to the ingenuity and talent of automotive engineers.
The few exceptions and their relatively modest perturbations perhaps prove the rule. The two most prominent disruptions relate to stringent emission and fuel economy standards in the 1970s. One effect was to give expanding Japanese automakers the opening to crack the US market more quickly than they would have otherwise. Of course the standards also prodded Detroit automakers to move from their oligopolistic and relatively lethargic behavior of the 1960s and become more innovative. The other major effect was the shift to light trucks, minivans, and SUVs, encouraged by the less stringent CAFE, safety, and emission standards applied to light trucks.
One explanation for the modest effect on markets and industry structure is that other factors—rising and falling fuel prices, increasing competition from Japanese and European automakers, increasing affluence, and shifting consumer desires—swamped regulatory effects. Consider, for instance, that vehicle prices increased much faster over the past decades than did costs associated with regulations, reflecting considerable improvements in vehicle quality and performance.
 The other explanation for the modest effect of regulation is that automotive companies have evolved a sophisticated array of advertising, marketing, financing, and pricing tools. Automakers use these marketing and financing tools to adjust to changes, whether imposed by government or external market conditions. And finally, in the long term, they draw on their robust R&D capabilities to innovate their way through regulatory challenges—building vehicles that are more durable, reliable, safer, and environmentally benign.
The challenge for government regulators as they formulate new regulatory initiatives is to find that tension point where tech- nological challenges are not disruptive. Easier said than done, though it has been accomplished to date with pollution and safety regulation. The new and perhaps more imposing challenge— especially in a political sense—is greenhouse gas emissions.
The past is a guide to the future, not a predictor. In the past, automotive markets and the automotive industry may not have been perturbed because the companies were all so large and integrated, and the barriers to entry so great. Will the industry of the future remain dominated by six to ten large, fully integrated, hundred-billion-dollar-plus behemoths? There is some evidence that the automotive industry of the future will be more fragmented, with more models, more personalizing of vehicles, and a shift away from massive assembly plants to smaller plants that assemble modules built by suppliers. More speculatively, there may also be a trend toward local mobility companies that lease and manage vehicles provided to users. If the industry does become more fragmented, then the standard technology-forcing regulatory processes of the past could indeed have a chilling effect. Or not. In any case, regulators should remain observant in monitoring industry and market changes to determine if different approaches are warranted.
So far, though, our overall findings are that regulatory actions have not distorted or perturbed automotive markets and industry structure much over the last few decades.


