First Impressions
Upon arriving in London (or any other major English city), the first thing an American notices is how few SUVs, pickup trucks, and full-sized minivans are on the roads. This is partly because of gasoline’s high price, currently about $5.80 per US gallon, and partly because English roads and parking spaces are so narrow. However, things do seem to be changing. Sales of SUVs are rising, particularly among suburbanites with children, as are sales of seven-passenger multi-purpose vehicles, which are slightly smaller versions of American minivans.
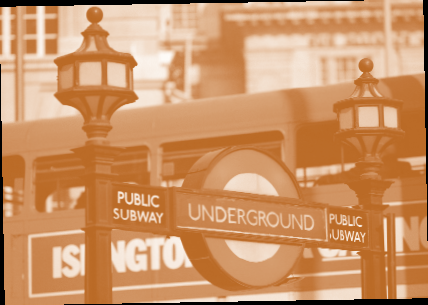
 One also notices that all London Underground stations and many bus stops have real-time electronic signs informing riders of anticipated arrival times of the next few trains or buses. This technology is informative, not operational: it doesn’t help the trains or buses travel any faster. However, it does give riders confidence in the transit system’s reliability. Rather than wait for an indeterminate time until a train or bus arrives, riders know exactly how long they will have to stand around and fidget.
It’s also notable that, whatever the law may say, pedestrians definitely don’t have the right-of-way when crossing an un-signalized intersection or street. This is particularly jarring for Californians, who, as pedestrians, are used to giving oncoming drivers the evil eye if they don’t stop. Given that the English refuse to make eye contact anywhere on any transportation system, greatly reducing certain social possibilities, my hometown right-of-way designation system simply doesn’t work in England. Londoners—particularly younger Londoners—are also habitual jay-walkers. It doesn’t matter if the crosswalk signal is red or green; if there’s no car coming, there’s a quick dash across the street, typically with eyes locked straight ahead. It may be that taking rather than being ceded right-of-way responsibility forces pedestrians to be more aware of their immediate surroundings. Certainly, in the six months I spent as a London pedestrian, I never witnessed any accidents. This may only be luck, however. According to the UK Department for Transport, in 2003 the rate of UK traffic fatalities involving pedestrians and cyclists was only slightly less than in the US.
Congestion Charging
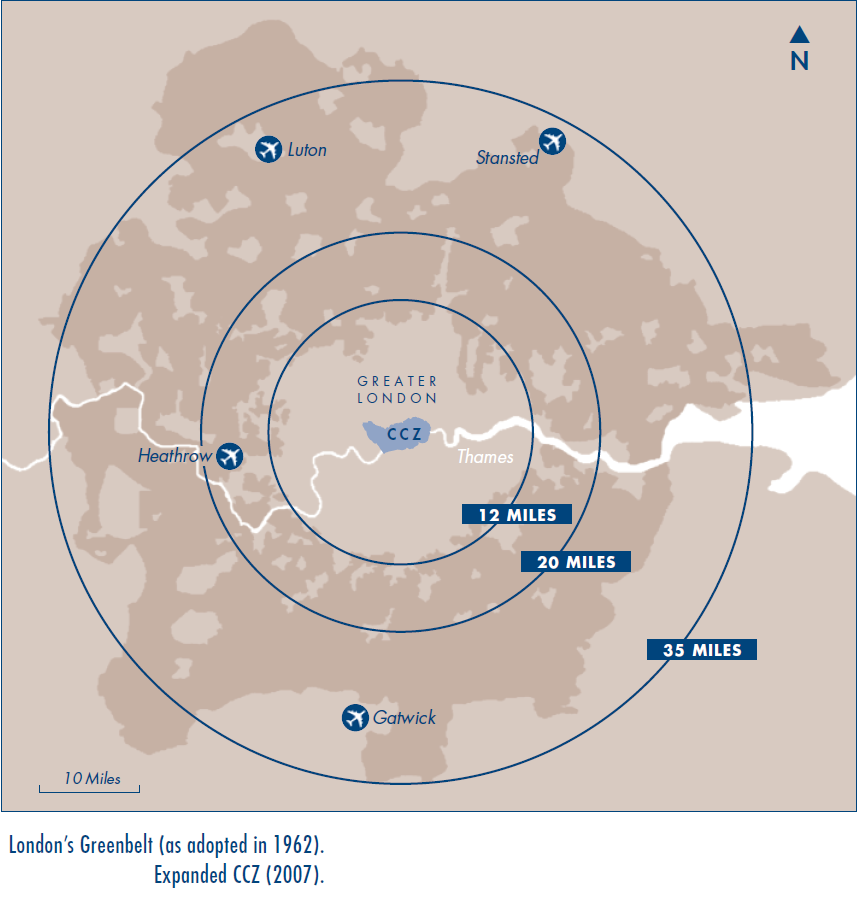
The newest transportation innovation to come out of the UK is the congestion charging zone (CCZ). Introduced in February 2003, the CCZ was the brainchild of London Mayor Ken Livingstone to reduce daytime traffic congestion on London streets and to generate revenue for public transit improvements. Motorists entering London’s inner ring road between 7:30 a.m. and 6:30 p.m. Monday to Friday are charged a fee of £8 (about $14). The CCZ encompasses the City of London—the city’s financial district— and the West End, its primary commercial and entertainment center. The wealthy residential areas of Westminster, Kensington, and Chelsea are not currently included. Some vehicles, such as buses, minibuses, taxis, motorcycles, and alternative fuel vehicles, are exempt from the charge. Residents of the zone, about 136,000 of Greater London’s seven million residents, are eligible for a ninety percent discount if they pay the charge a week or more ahead. The CCZ includes the American Embassy, but the Bush Administration has so far refused to pay the fee, arguing that it is really a tax, from which foreign diplomats and their staffs have traditionally been exempt.
 The CCZ’s technology is not particularly advanced. Over two hundred closed-circuit TV cameras installed at the edge of the CCZ take video pictures of the license plates of vehicles entering the zone. The images are transmitted to a control center where they are identified and matched to the plate numbers of cars whose owners have prepaid to enter the CCZ; private vehicle owners who have not prepaid and do not pay by midnight are fined £60 ($95).
When first adopted in February 2003, the fee was only £5 ($8.75) per trip. Prior to its implementation, critics worried that the CCZ would produce massive numbers of misidentifications, increased traffic congestion just out- side the zone, and financial hardship for businesses inside the zone. None of this came to pass.
How well has the CCZ achieved its twin goals of reducing central area traffic congestion and increasing public transit use? According to the most recent monitor- ing study undertaken by Transport for London, as of 2004 average congestion levels within the zone were down thirty percent. Private vehicle traffic entering the CCZ had declined from just under 200,000 cars per day in the autumn of 2002 to 130,000 in the autumn of 2004. Over the same period, the average number of bus passengers entering the CCZ during the morning peak period increased from 102,300 per day to 149,200 per day, while excess bus waiting times during the peak period declined by nearly forty percent. This was due more to an increase in the number of buses in service than to a reduction in street congestion. The average number of Under- ground passengers entering central London during the weekday morning period fell by eight percent between 2002 and 2004, a decline London transport planners attribute to rising fares. Street congestion in the neighborhoods adjacent to the CCZ was largely unchanged, as were measurable air pollution levels, retail business levels, and downtown property values.
London Mayor Ken Livingstone has declared the zone a success. Despite a pledge not to raise the CCZ fee for many years, in September 2005, Livingstone increased it from £5 to £8. Similarly, despite poll results showing overwhelming public opinion against doing so, Livingstone’s office has moved to extend the zone westward to include Kensington, Westminster, and Chelsea, effectively doubling its size and more than doubling the number of CCZ residents. Livingstone argues that both steps—the fee increase and the zone enlargement—are needed to further reduce traffic congestion and localized air pollution hotspots. He says the increased revenue is essential if services on London’s public transport system, including the Underground and local buses, are to be modernized and upgraded to make them more attractive to potential riders. Indeed, Livingstone’s ability to realize his vision of Greater London as the world’s leading city for businesses and residents rests on his ability to keep the city moving. Other cities throughout the UK are also looking at the possibility of similar zones—albeit chiefly as a means of raising revenue—and slowly but surely congestion charging and toll roads are working their way into the majority Labour Party’s mainstream national transportation policy.
Public Transit: The Search for a Sustainable Business Model
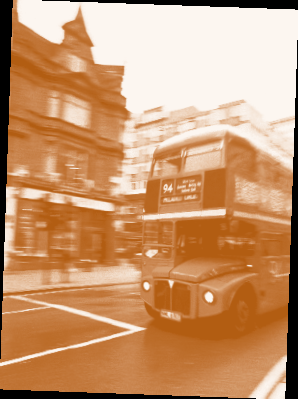
Traveling on public transport in London isn’t cheap—unless you are over sixty, in which case it’s free after 9 a.m. The least expensive ticket on the London Underground (a.k.a. the Tube) is £1.70 ($3.00) per trip for travel within a single zone. Riding the bus is a bit less expensive, but by no means cheap. According to Transport for London, the public agency that oversees all transit service in the greater London area, in 2004 and 2005 average Tube ridership reached a record level of 2.7 million riders per day. By contrast, London area buses carried an average of nearly 5 million passengers each day. Almost fifty percent of the 3.5 million workers who commute to London each day arrive by public transport.
 And yet, London’s public transit system is perennially in financial trouble. Its operating costs and particularly its labor costs are too high. Its tunnels, cars, and station passageways are too narrow to comfortably accommodate peak demand. Train cars lack air conditioning and can be stiflingly hot in the summer. They are also slow. Underground stations are old, inefficiently spaced, and many are in need of renovation. Indeed, the only reasons Londoners still use the Tube in the volumes they do is because of tradition—and the fact that weekday driving and parking in and around central London is an excruciating experience.
These problems are not unique to London. Most of the world’s urban rail transit systems built in the first half of the 20th century suffer from some or all of them. What makes London different is the size of its transit system, the number of bottle- necks, the backlog of unmet maintenance needs, and the lack of high-density origin nodes.
Greenbelts and Travel Behavior: Beware of What You Wish For
Most large English cities have been ringed by greenbelts for more than fifty years. The largest and most famous English greenbelt, the one surrounding metropolitan London, includes more than 1.2 million acres (about the same as the city of San Jose), and has remained essentially unbreached since it was established in 1955.
Evaluated against its original purpose, London’s greenbelt has been remarkably successful. It has prevented American-style urban sprawl and preserved working rural landscapes and open space close to London. It has discouraged office employment from leaking out of central London, and, by reinforcing agglomeration economies, may have helped London maintain its preeminence as a world financial center.
Not all of the London greenbelt’s effects have been so positive. A much-publicized 2004 government report highlighted the role of land-use regulation in general and London’s greenbelt in particular in suppressing needed new housing, pushing up housing prices, and depressing housing affordability. This is a story that will be immediately familiar to any Californian.
Unable to build affordable family homes within London or its surrounding greenbelt, homebuilders and buyers have leapfrogged past the greenbelt to more distant and unprotected locations. The result has been a disjointed form of urban sprawl that, like its more continuous counterpart in America, can’t be efficiently served by public transit or walk- ing. Between 1990 and 2002, the proportion of personal trips in the UK made by private car increased from 57 percent to 64 percent, while the proportion of non-auto trips declined correspondingly. The biggest losers were local bus service and pedestrian travel.
Road Use, Congestion, and Transport Planning and Investment
As it is everywhere else in the world, traffic congestion in the UK is getting worse. A 2001 public opinion poll found that road congestion was regarded as the most serious issue facing local government.
Surface transportation planning and funding responsibilities in the US are shared by federal, state, and local governments, but in the UK all transportation planning responsibilities lie with the national government in London. It is therefore not surprising to find that the problem of traffic congestion, which is much more severe in the greater London area than elsewhere in the UK, forms the heart of current national transportation policies.
The good news is that roads in the UK aren’t as congested as they might be. The bad news is that they are congested enough. Between 1990 and 2003, average traffic speeds in the London metropolitan area during the morning peak travel period fell from 16 to 15 miles per hour. This may not sound like much, but multiplied by the several million vehicles that use London area roads each morning it represents a significant increase in congestion.
The government’s most recent National Transportation Policy, issued in 2004, proposes a three-theme approach to reducing congestion: (1) increased, sustained, and balanced investments in roadway, rail, and freight capacity; (2) better demand management, expanded toll roads and congestion charging, and improved accountability standards for public transit operators; and (3) a 25-year transportation planning and funding horizon to prioritize transport investments in collaboration with regional and local stakeholders. With respect to funding, the government seems to be putting its money where its mouth is. Government investments in public roads, National Rail facilities and rolling stock, and port infrastructure in 2003–2004 was up more than fifty percent over 2000–2001 levels.
The Low-Cost Airline Revolution
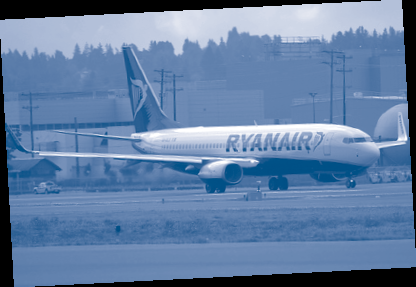
UK-based Ryanair, Europe’s first low-cost airline, entered service in 1985 (South- west Airlines began flying in the US in 1971). Ryanair’s home base is Stansted Airport, forty miles northeast of central London. A second low-cost airline, easyJet, entered service in 1995, and offers limited flights in and out of Heathrow Airport as well as more extensive service to and from Gatwick, Stansted, and Luton airports. Several established air carriers, including British Airways, Ireland’s Aer Lingus, Air France, and British Midland have since entered the market with their own low-cost flights, but Ryanair and easyJet remain the undisputed market leaders.
Ryanair operates direct service between six airports in the United Kingdom and Ireland and 85 airports in western and central Europe, including many in smaller markets. EasyJet’s European destinations are similar to those of Ryanair but include some large cities as well. Both Ryanair and easyJet have copied Southwest Airlines’ business model of using a single aircraft type for quick-turnaround flights of under a thousand miles. Both offer extremely low fares over the Internet. Indeed, on many Ryanair flights, passengers who book their trips two weeks in advance pay only airport taxes and fees. Service is basic, but planes are consistently full. To help control costs, Ryanair makes passengers board via outdoor stairs, even in the rain.
 Passengers don’t seem to mind. In 2004, Ryanair and easyJet together flew 49 million passengers while British Airways, with many more airplanes and a much more extensive route structure, flew 35.7 million passengers. In 1995, Stansted and Luton Airports—the home airports of Ryanair and easyJet—accounted for only five percent of total airline passenger arrivals and departures in Britain. By 2004, this percentage had increased to fifteen percent. Should current trends continue, Stansted will surpass Gatwick to become Britain’s second largest airport (in terms of passenger traffic) some time during the next decade.
The effect on leisure travel behavior has been nothing short of amazing. Many more UK residents travel to Europe for short and long vacations than in the past and they travel much more frequently. The second-home market in Spain and southern France has boomed, largely because of an influx of UK money. Secondary cities like Manchester, Birmingham, Edinburgh, Glasgow, and Leeds are now much more closely linked to the European continent, and indeed to other parts of the UK.
The effect on other air carriers and modes has been equally dramatic. Carriers such as Aer Lingus and Air France that have adapted to the low-cost model have prospered. So too have long-distance carriers like British Airways and Lufthansa which have been able to successfully differentiate their service from that of low-cost airlines—and to keep them out of Heathrow Airport. Short-haul carriers like Swissair, Sabena, and SAS have not been as lucky and have been forced to merge. The biggest effect, of course, has been on Eurostar cross-Channel passenger rail volumes which, as of 2004, were down nearly twenty percent from their 1998 peak. Forced to compete with Ryanair and easyJet on fares, Eurostar operations lost £42 million ($73 million) in 2004, down from £92 million ($161 million) in 2002. Within the UK, Ryanair and easyJet’s inability to get gate space at close-in urban airports with fast downtown rail connections has hampered their expansion potential while protecting existing rail operators.
 To the degree that European integration moves ahead and includes the UK, it will not be because of the results of national plebiscites or administrative decisions made in Brussels. It will be because of the frequency and convenience of intra-European air travel, and because of the typical European’s increased familiarity with other parts of Europe. People will start thinking of themselves both as residents of their home country and as Europeans—in much the same way that US residents see themselves as both Americans and residents of particular states or metropolitan areas. Such is the power and potential of travel.
Professor Landis was ably assisted in this report by planning professors Michael Batty, David Bannister, and Sir Peter Hall of University College London.
Further Reading
Kate Barker, et.al. Barker Review of Housing Supply – Final Report Recommendations (London: Bank of England, 2004).
CBI-KMPG. Congestion Charging. CBI Policy Work Website , 2005.
National Statistics. Transport Statistics Bulletin: Road Casualties in Great Britain; Main Results 2004. (London: Department for Transportation, Transport Statistics, 2005).
Schaller Consulting. Commuting, Non-work Travel, and the Changing City: An Analysis of Census 2000 Results for New York City. 2002.
Transport for London. Central London Congestion Charging Scheme Impacts Monitoring Summary Review: January 2005. (London, 2005).