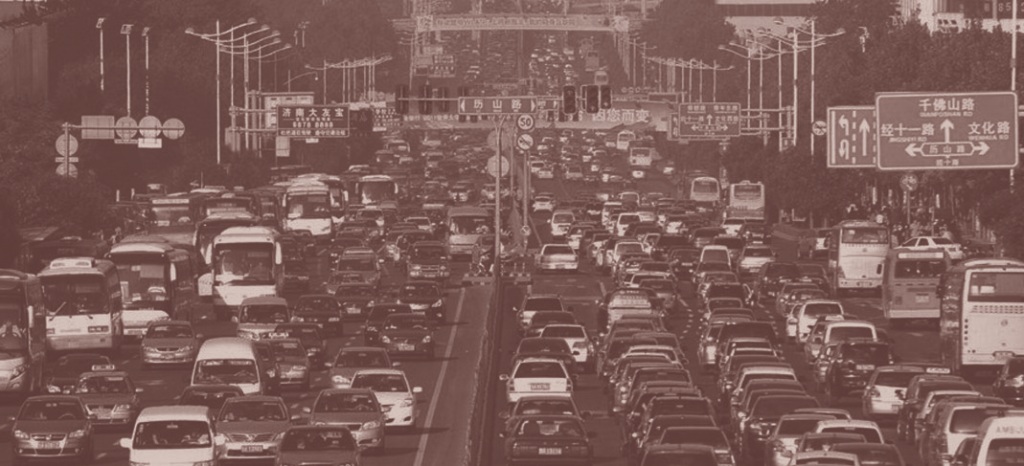
In 2010, China surpassed the US and all other countries in vehicle sales, and will no doubt retain its number one ranking for decades. But how big will China’s vehicle market become? The answer is of great importance for the entire world. Rapid Chinese motorization has alarming implications for both the environment and global energy resources. China is already the world’s largest CO2 emitter and second-largest oil importer. Yet its vehicle ownership rates are still a fraction of those in the US—58 vehicles per 1,000 persons in 2010 compared to 804 per 1,000 in the US. Clearly, the market for vehicles in China will grow. Most forecasts anticipate Chinese growth leveling off at an ownership rate of about 200–300 vehicles per 1,000 persons in 2030 or later. But what if vehicle growth is even faster? Could vehicle ownership rates reach Western European and Japanese levels of about 600 vehicles per 1,000 persons?
Past research on this question gives cause for concern. In the last decade, several major studies forecasted growth rates and ownership levels in the Chinese vehicle market. All of these studies projected 6 to 11 percent annual growth in Chinese vehicle ownership—far lower than the 19 percent annual growth during the past decade. Were the recent high growth rates a temporary aberration related to a surge in China’s economic growth? Or were forecasters too conservative in their estimates?
The Herd Instinct
The majority of forecasts anticipate relatively slow growth in China’s vehicle population. China’s fast growth in motorization may threaten global oil supplies and exacerbate climate change. Indeed, if China’s vehicle ownership rate reaches 600 to 800 vehicles per 1,000 persons, equivalent to rates in Europe and the US, respectively, then China’s total vehicle population would approach one billion—more than four times the number of vehicles in the United States today. Even at a much lower level of 300 vehicles per 1,000 persons, the worldwide impact would be huge: Chinese vehicles alone would consume 12 to 18 percent of the total oil produced today. Fear of the consequences of faster growth rates and higher overall vehicle ownership seems to pervade and inhibit most forecasts.
 Further contributing to the conservative forecasts of vehicle ownership may be the reality that forecasters in large, developed countries have not seen rapid economic growth anytime in their professional lives. From their vantage point, a sustained 6 percent annual growth rate in GDP is very high, even though all major car-producing countries in the world exceeded such growth rates for decades during their industrialization phases.
To understand how and why these forecasts tend to be so conservative, we examined the assumptions and methods underlying previous forecasts. First, they all base their forecasts on China’s GDP growth. Using GDP as a predictive variable, forecasters generally assume that vehicle sales will start slowly at low levels of per-capita GDP, accelerate as the nation prospers, and then slacken as the market matures. Almost all successful new products and technologies follow this trajectory. Although this “S” curve construct is a conceptually sound analytical framework to forecast the market for new products, the details are subject to great uncertainty.
One challenge of using a GDP-based approach starts with the accuracy of the GDP forecasts themselves. Forecasters rely upon official projections of China’s GDP growth, which are heavily influenced by Chinese bureaucrats’ conservative GDP growth targets. Since China’s political leadership promotes local officials for achieving and surpassing their own targets, local officials have an incentive to under-predict GDP growth. Using these low-balled growth rates, forecasters projected real GDP growth of 8.6−9.5 percent in the years following the baseline (typically the year 2000), but then used lower rates of 7−8 percent and 4−6 percent in the following 20 to 30 years. Although China’s GDP growth rate dropped a few percentage points in early 2012, it remains to be seen whether the slowdown will continue.
Forecasters rely upon official projections of China’s GDP growth, which are heavily influenced by Chinese bureaucrats’ conservative GDP growth targets.
The second and more problematic challenge of using the S-curve approach is estimating the relationship between GDP and vehicle purchase behavior. Based on historical analyses, it is widely accepted that vehicle ownership growth rates rapidly accelerate at incomes around $3,000 to $5,000 per capita per year (in year 2000 dollars). Vehicle ownership growth rates then typically peak around $10,000, followed by a slow decline.
Will China follow this same pattern? China’s current rate of vehicle ownership is higher than that of comparable countries when they were in the same stage of economic development. At the income level of $2,000 per capita, only Thailand surpassed China’s ownership rate of 38 vehicles per 1,000 people.
 Even if the general S-curve relationship between income and car ownership were to hold in China’s case, the steepness of the growth rate remains uncertain as China approaches per-capita GDP of $10,000. Simply put, Chinese vehicle growth rates may not begin to slow at this per-capita GDP. It is difficult to specify this relationship accurately. In fact, the shape of the S-curve varies greatly across countries, as one might expect given countries’ unique histories, geographies, and policies. When the US began to motorize a century ago, for instance, the country’s GDP had already surpassed $5,000 per capita. Forecasters find predicting China’s vehicle growth rate challenging because few countries can serve as models or analogs to China, and different income-vehicle relationships produce vastly different vehicle population outcomes.
In most studies of Chinese vehicle growth, forecasters assigned saturation levels much lower than those observed in the US and generally lower than those observed in Europe and Japan.
A third challenge in using an approach based on the S-curve is determining the level at which vehicle ownership reaches saturation—when the curve flattens out. Choosing the correct saturation level is crucial since this decision determines the steepness of the curve over time, and thus how fast vehicle sales will grow in the future. When forecasters assume a high saturation level, they lengthen the steep part of the curve to predict steady vehicle growth rates for a longer time. With a low saturation level, growth rates are lower. In most studies of Chinese vehicle growth, forecasters assigned saturation levels much lower than those observed in the US and generally lower than those observed in Europe and Japan. One study predicted a Chinese saturation level of only 292 passenger vehicles per 1,000 persons, far below the saturation level of almost every nation in the developed world.
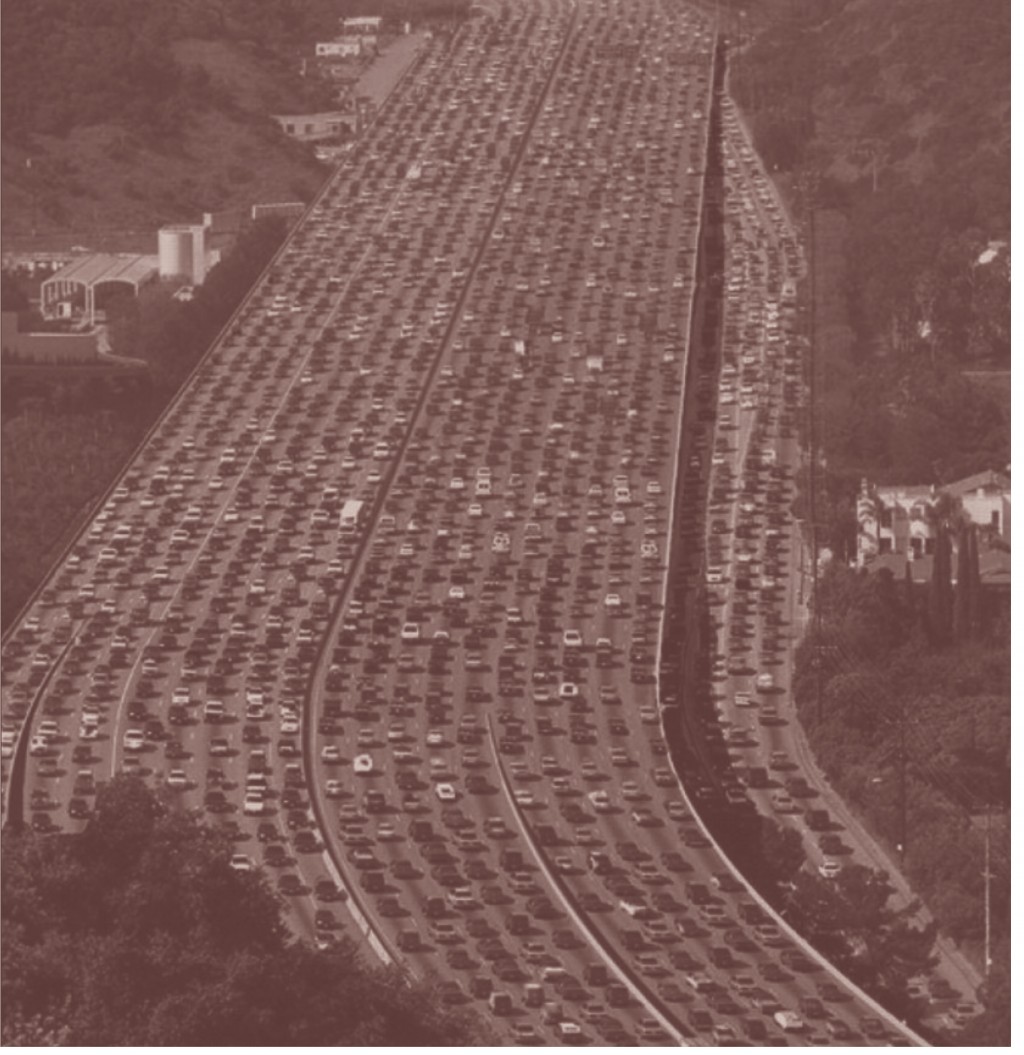
 In their choice of saturation levels, forecasters seem to assume that the current growth rate is unsustainable. Based on that assumption, growth rates would soon slacken and ownership rates flatten out at levels far below those of the US and Europe. Forecasters appear to fear that the world (and China itself) cannot accommodate the resulting energy demand and greenhouse gas emissions. Regardless of their reasoning, forecasters seem reluctant to grapple with the implications of more robust vehicle growth in China.
Fourth, in previous studies, forecasters built prediction models based on data from 45 to 122 countries, many of which are tiny or do not have their own automotive industries. We suggest that the experiences of countries such as Singapore are irrelevant in predicting China’s vehicle growth. The dynamics of market development are very different in countries with large auto industries. Countries with large car-producing industries tend to support the development of their domestic production and thus experience much higher vehicle growth than other countries.
Finally, almost all previous studies derive vehicle growth rates from inappropriate time periods. Most previous forecasts relied on World Bank or International Monetary Fund data only as far back as the 1960s. Thus, forecasters’ projections ignored the 1950s and earlier when many large vehicle-producing countries rapidly motorized. For example, one study using post-1960s data estimated income elasticities of vehicle ownership (vehicle ownership growth rate divided by GDP growth rate) of only 1.43 for Thailand, 1.98 for India, and 2.2 for China from 2002 to 2030. In contrast, we found that income elasticities for large vehicle-producing countries during their rapid growth periods were over 2.6. Higher income elasticities mean many more vehicles purchased.
Our Analysis
Given these many methodological and data pitfalls, we took a conceptually simpler approach. We mapped onto China the historical growth patterns of large vehicle-producing countries and benchmarked the motorization trajectories of these countries to the date when they historically reached China’s current vehicle-per-capita ownership. We selected countries that 1) had large populations, 2) were major vehicle producers, and 2) were at a higher stage of industrialization and motorization than present-day China. Countries were excluded if they 1) had distorted market development, such as former Eastern Bloc countries, or 2) had slow economic growth over a protracted period, since that did not match China’s experience. The seven countries that remained were Brazil, Germany, Italy, Japan, South Korea, Spain and the United States.
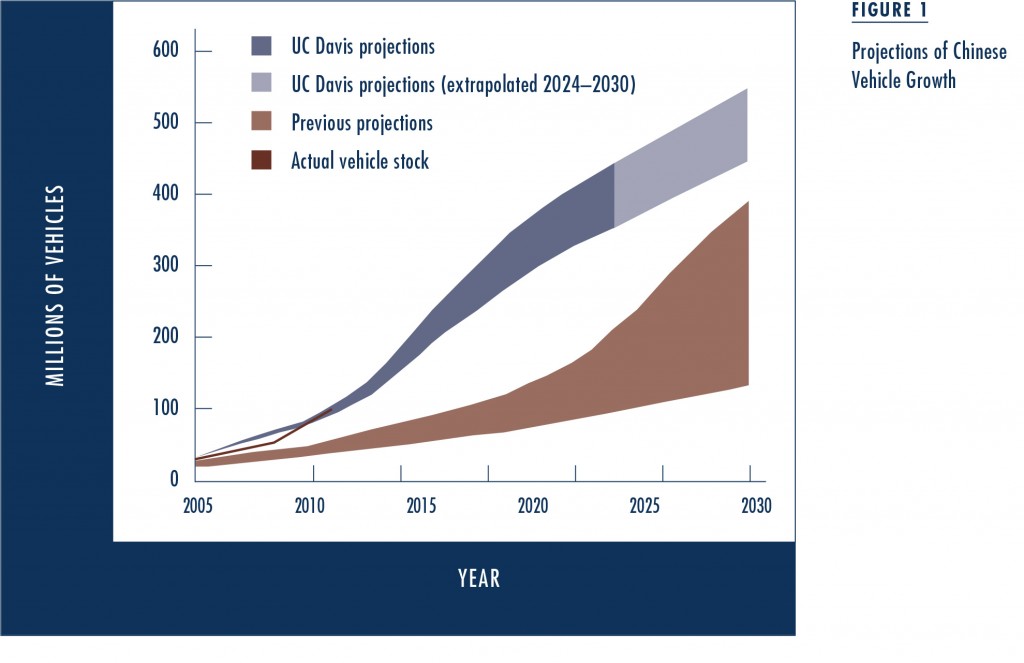
An important distinction between our analysis and other studies is that we drew upon the early motorization experiences of Europe, Brazil, Japan, South Korea, and the US. By selecting fewer benchmark countries and putting greater effort into finding data from the 1950s and earlier, we captured experiences analogous to China’s current situation. We conclude that the findings of all previous studies—with projected annual vehicle growth rates in China of 6 to 11 percent from the early 2000s to 2020—are conservative. With our approach, we forecast that China’s vehicle population will increase by 13 to 17 percent per year, well above what others forecast, reaching as many as 419 million vehicles in 2022.
 Our forecasts may be too high, and China’s vehicle growth rate may be slower. This will only happen, however, if the Chinese economy stagnates, as Brazil’s did in the 1980s and 1990s, or if China intervenes aggressively to restrain vehicle ownership, as four Chinese cities have already done. If the Chinese economy continues to boom, and China does not aggressively restrain car ownership, then our scenario of higher vehicle growth will likely prevail. If that happens, actual global oil use and carbon emissions will undoubtedly be far greater than the International Energy Agency and others have forecasted.
If the Chinese economy continues to boom, and China does not aggressively restrain car ownership, then our scenario of higher vehicle growth will likely prevail.
We hope that we are wrong.
This article is adapted from the longer version, “China’s Soaring Vehicle Population: Even Greater Than Forecasted?” originally published in Energy Policy.
Further Readings
Daniel Sperling and Deborah Gordon. 2010. Two Billion Cars: Driving Toward Sustainability, Oxford University Press. Translated into Chinese and published by Shanghai Jiaotong University Press.
Hong Huo and Michael Wang. 2012. “Modeling Future Vehicle Sales and Stock in China,” Energy Policy, 43: 17–29.
Paul N. Kishimoto, Sergey Paltsev, and Valerie J. Karplus. 2011. “The Future Energy and GHG Emissions Impact of Alternative Personal Transportation Pathways in China,” The Massachusetts Institute of Technology Joint Program on the Science and Policy of Global Change, Report 231.
Yunshi Wang, Jacob Teter, and Daniel Sperling. 2011. “China’s Soaring Vehicle Population: Even Greater Than Forecasted?” Energy Policy, 39(6): 3296–3306.