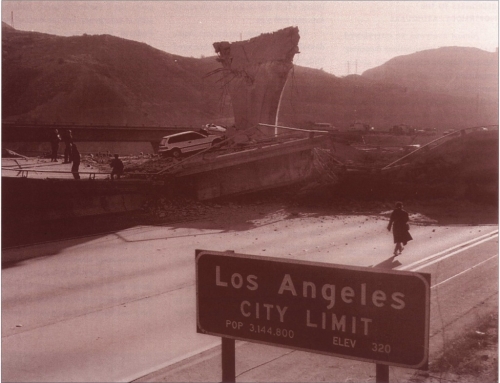
[sharelines]Most transit signage ignores the special needs of children, foreigners, and the disabled.
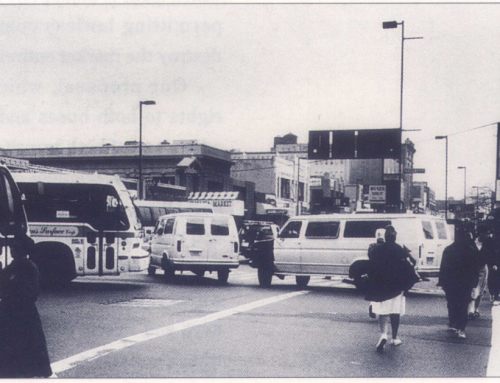
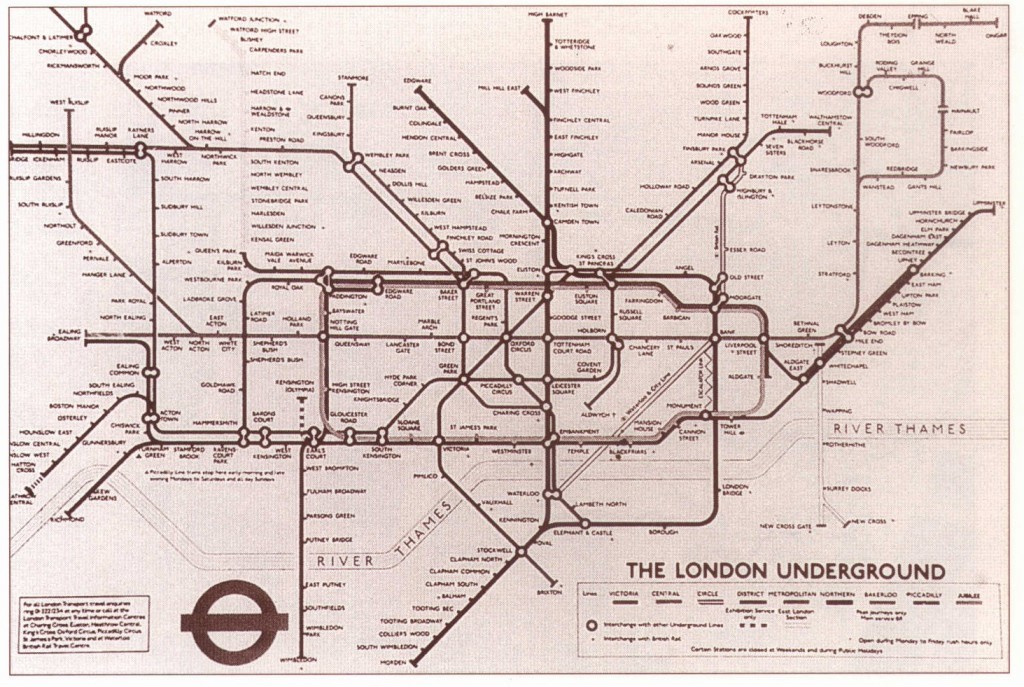
Many people find the prospect of travel by public transit complex and unpredictable, rather than inviting. Riders must be able to read English, understand complex route maps and schedules, and figure out fares. Some must be able to use electronic ticket and information devices. These systems may seem simple, but many transit users have difficulty making sense of the transit information that’s usually available. Most systems ignore the special needs of children, foreigners, and users who are illiterate, sight-impaired, hearing-impaired, or otherwise disabled.
Computer-aided traveler information systems could eliminate much of the guesswork for riders by providing information tailored to diverse users and their needs. If information systems could make transit less intimidating, they might also help to increase ridership. However, the design of traveler information systems must simplify a rider’s transit experience, rather than add another layer of complexity.
We have studied the social and psychological characteristics of transit users in an effort to design effective information systems. Based on these findings, we offer some suggestions for “SmartMaps,” systems that make transit riding more accessible to everyone.
Social Characteristics of Transit Users
 The form of transit information is just as important as its content. Given the diversity of transit users and the complexity of transit systems, information must be carefully designed to communicate with major user groups rather than just a small group of expert travelers. Transit users differ in their familiarity with the system and with the town, city, and region. Their understanding of the system differs based on their age, education, location, cultural and language background, and literacy skills.
A high proportion of California’s transit users are foreignborn, with limited English reading skills and minimal knowledge of their cities and regions. According to the Southern California Rapid Transit District 1986 On-Board Survey, most transit users in the region were in lower-income brackets, with 60.5 percent earning less than $15,000 annually. The majority of riders were Hispanic/Latino (44.2 percent) and African-American (23.2 percent). Most were under 35, with 37.6 percent of riders between 15 and 24 years old. Given the choice between an English or Spanish questionnaire, 28 percent of participants chose Spanish.
Another survey, the 1985 AC Transit On-Board Survey in the Bay Area, found similar traits. More than half the passengers were African-American, Asian-American, Hispanic, or Native-American; and nearly half had incomes under $20,000. Most depended on buses for transportation-over 80 percent of weekday passengers rode AC Transit buses at least four days a week. Almost 20 percent of weekday passengers were teenagers, while only about 10 percent were over 64 years old.
Literacy Considerations In Designing Advanced Transit Information Systems
Available surveys suggest that many transit users are likely to have difficulty understanding both textual and numerical information, including maps, schedules, fares, and procedures required for using transit. To be comprehensible, transit information must communicate with people of varied language backgrounds and minimal literacy levels.
The 1992 National Adult Literacy Survey interviewed nearly 13,600 individuals in the United States, age 16 and older, to evaluate their prose literacy (ability to understand textual material), document literacy (ability to read bus maps and schedules, among other things), and quantitative literacy (ability to do mathematical operations).
 Results showed that 21 to 23 percent of adults surveyed performed at the lowest of five skill levels for each type of literacy, while another 25 to 28 percent performed at the next lowest level. Of those at the lowest level, one-fourth were immigrants who knew little English, two-thirds had not completed high school, and one-third were elderly. Thus, according to the survey, about half the adult population in the United States has very limited literacy skills, especially in document literacy. This finding has major implications for any organization involved in public communications and information.
African-American, Native-American, Hispanic, and Asian/Pacific Islander adults were more likely to have skills in the lowest two literacy levels than were white adults. Slightly over 40 percent of all adults at the lowest levels were living in poverty. Older adults demonstrated much lower literacy skills than younger adults, especially those past age fifty-five. This is probably because older adults have fewer years of formal education than younger adults.
Implications For Transit Information Systems
Based on the transit-user characteristics discussed above, we conclude that people who are most dependent upon public transit are also most deficient in literacy skills – including children, racial minorities, and the disabled, poor, elderly, and less educated. Conventional transit information systems fail to meet the needs of diverse users because they are designed primarily for middle-class, well-educated, English-speaking adult users.
Further, transit information tends to be generic and may not suit individual needs. Often, users receive too much information, becoming overwhelmed rather than enlightened. Maps and verbal directions don’t clearly connect the transit system to the overall environment. The focus is on the transit system, not on understanding how the system fits into the surrounding urban and regional context.
Cognitive Processes in Wayfinding
In addition to considering transit users’ social characteristics, design of an effective traveler information system also requires an understanding of how people use maps and find their way to destinations. Psychological research indicates that the cognitive processes of wayfinding are of two main types: (1) the sequentially arranged images and corresponding sets of decisions that help people find routes to destinations; and (2) “cognitive maps,” or mental representations of overall spatial relationships.
 While most researchers agree that people primarily use sequential information for wayfinding, cognitive maps can streamline the wayfinding process. Someone with a clear mental picture of a place tends to be more adept at finding routes and shortcuts within the area than someone with a less-developed cognitive map.
To develop an effective cognitive map that includes the route to a destination, one must be familiar with the location. But lack of familiarity can be remedied by using simulation techniques that can quickly familiarize newcomers with a complex environment even more quickly than actually experiencing the same environment.
When encountering a new environment, individuals who have first been introduced to the environment through a form of simulation-for example, a map-feel more comfortable and secure than do those who are not familiarized beforehand. The most effective simulation procedure uses a combination of presentation methods.
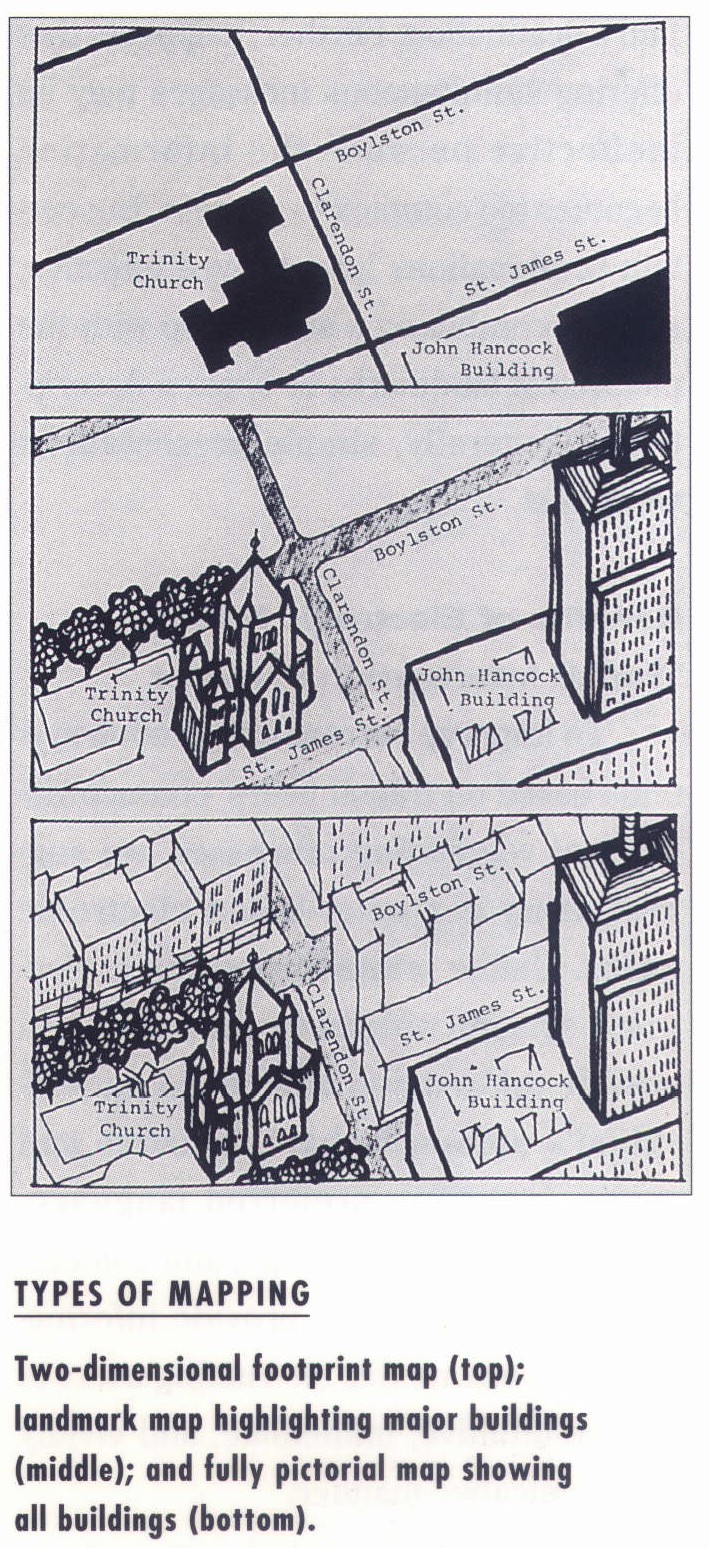
A sequential, “walk-through” presentation- through animation or a series of still photographs-seems to be effective only if coupled with a bird’s eye view of the area. This allows the mind to assimilate two kinds of information: spatial relationships (cognitive maps) and procedural information (network maps) .
Viewers must learn to recognize specific elements in the urban setting-structures that are memorable and identifiable by their size and shape. In addition to landmarks, a simulation presentation should highlight the organizing features of the environment, such as its street pattern.
Studies show that people can process only limited amounts of information. Overly detailed pictorial maps can provide too much information and hinder one’s ability to find a destination. Further, it appears that offering simultaneous messages may be ineffective because the information becomes too complex to process. But certain combinations have proved effective, such as combining a street map with the pictures of landmarks or spoken descriptions. Generally, simple presentations work best.
Benefits of Electronic Media In Transit Information Systems
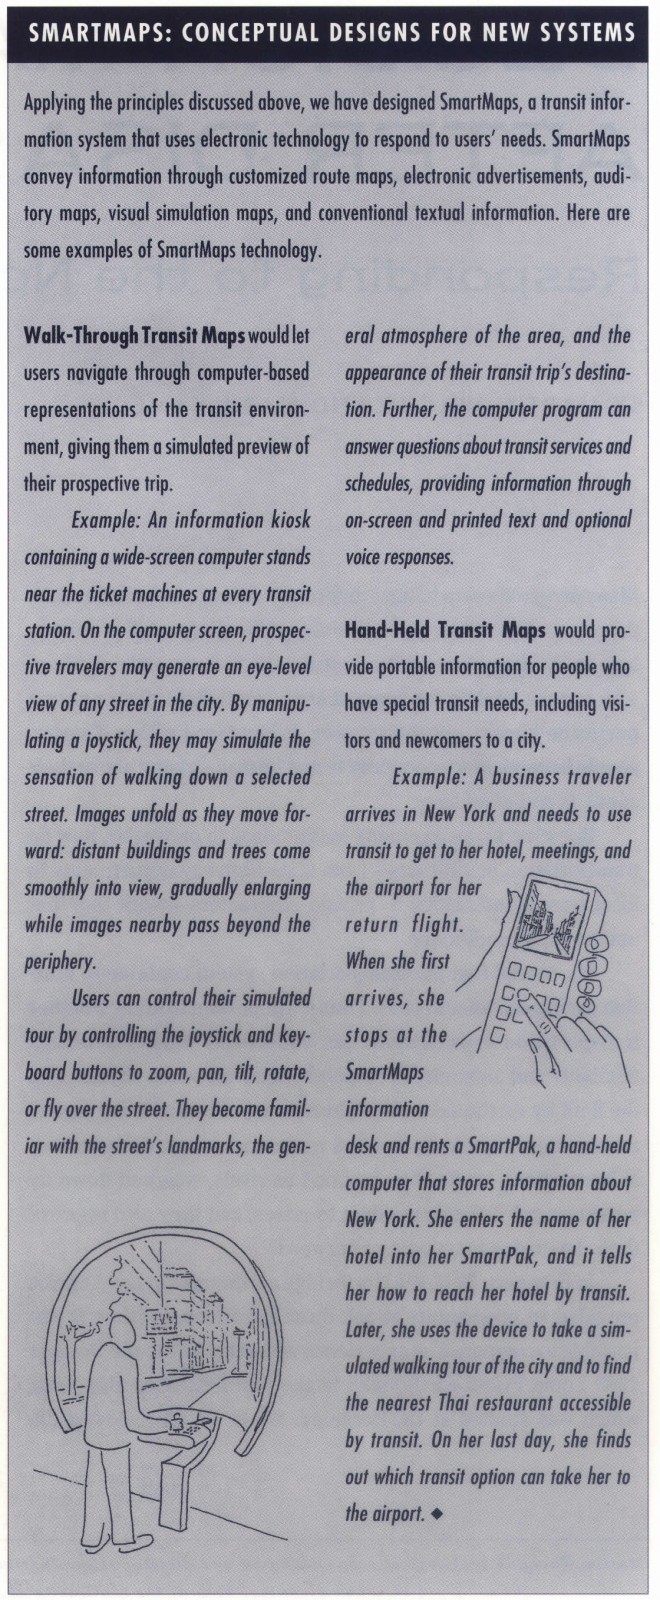
 To improve current information systems based on transit users’ characteristics and wayfinding processes, we suggest using computer-based electronic media. Unlike printed material, an electronic system, with its vast memory, can provide information tailored to an individual’s personal characteristics and needs, including preferred language, graphical or textual format, and content. It can simultaneously provide information in several media, instructing users in a more intuitive, immediate, and vividly communicative manner.
Electronic systems can engage users in an interactive give-and-take, permitting travelers to obtain the information they need, without extraneous information. Users receive information sequentially and with a level of detail suited to their needs.
Design Guidelines for Transit Information Systems
Based on our research, we suggest the following criteria for developing effective transit information systems:
- Several levels of on-screen help should be available to accommodate different users’ levels of expertise in using the information system. Skilled users should be able to bypass information they do not need. On-screen tutorials should be available for novices. In addition to different skill levels, the system should accommodate different levels of cognitive ability and perceptual orientation.
- The system should be interactive, to allow users to make specific requests and avoid being confounded by extraneous information. Possible methods of user input are track balls, touch screens, joy sticks, and key pads.
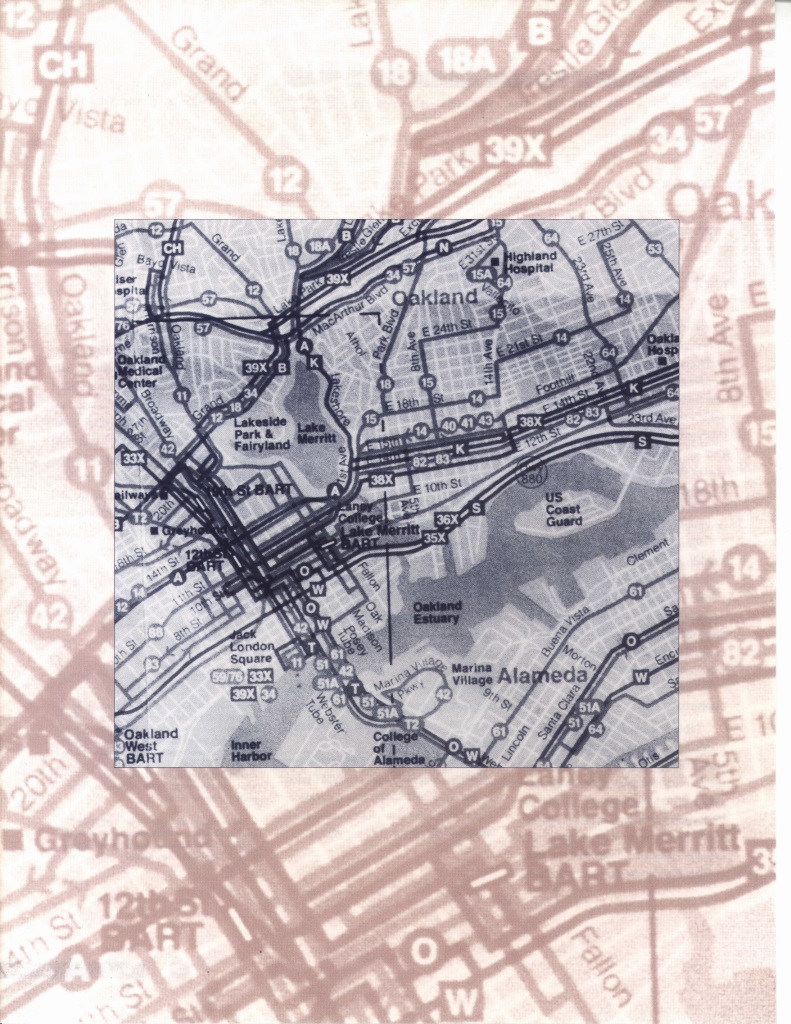
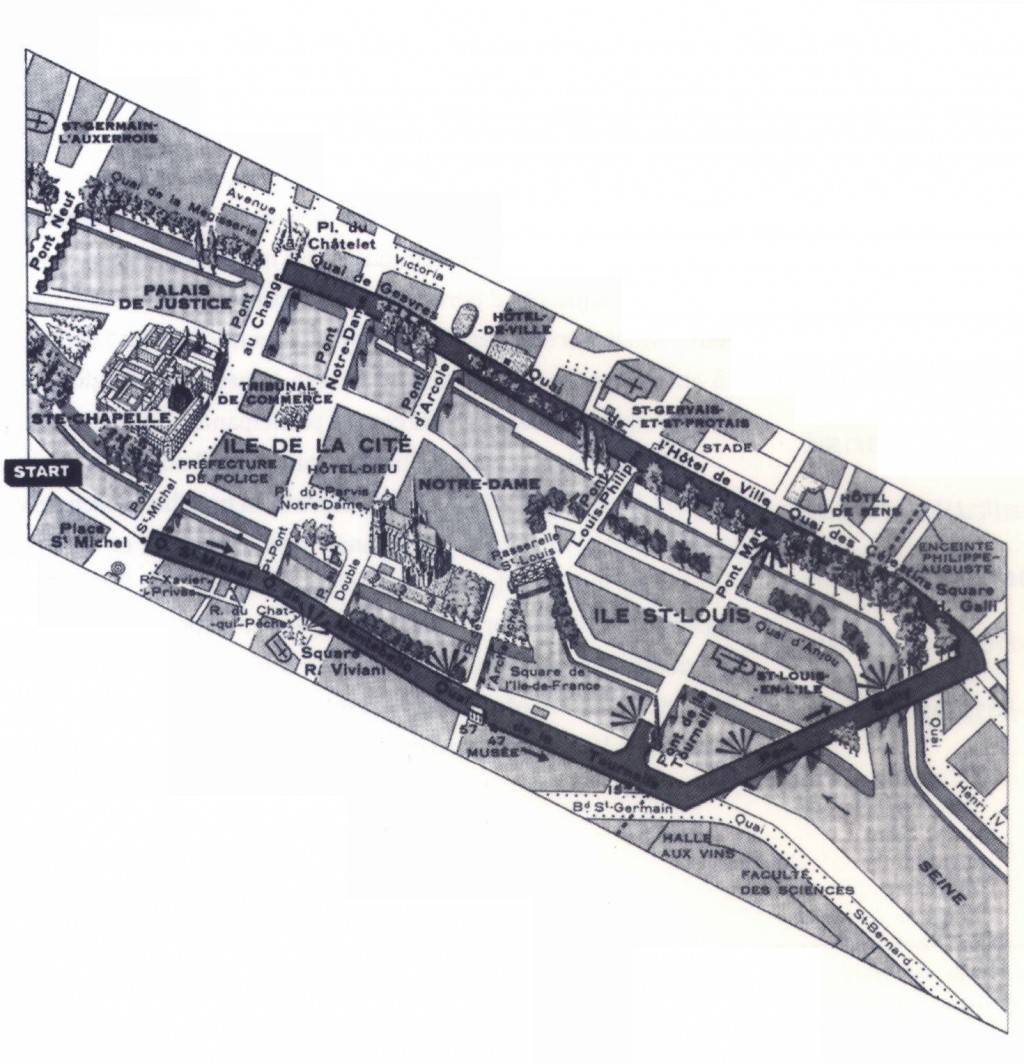
- Maps and aerial views should show the organization of streets and paths, properly aligned with the actual environment. This organization should not be obscured by unnecessary graphics such as insignificant buildings or text. The system should provide printed directions and a simple map of the route.
- Maps should include recognizable images of landmarks and important places.
- Sequentially arranged walkthrough images of a route should be coupled with an overview of the environment, such as a map, an aerial view, or, preferably, a three-dimensional model. Full length videos of the route are unnecessary, time consuming, and too detailed. Selected walk-through images should include the points along the route where changes occur and should highlight important landmarks.
- Graphically presented route information should be accompanied by written and spoken descriptions of the route to reinforce learning. Spoken descriptions are more accessible to the general population than written information.
Conclusion
One reason people avoid transit is the lack of understandable information on routes, schedules, fares, and procedures. We can improve the communication of transit information by taking advantage of new electronic technology. But advanced information systems can create another layer of complexity if they don’t accommodate the majority of users, especially the vast number of potential riders who have difficulty understanding directions and maps. An effective system must be designed for diverse users, especially transit-dependent persons who may lack literacy skills or be unfamiliar with the city’s geography.
Acknowledgments
Raymond Isaacs provided major research assistance, along with Glenn Gilbert, Joey Goldman, Gustavo Llavaneras, and Anthony Torres.
Further Readings
AC Transit, AC Transit On-Board Survey (Oakland: AC Transit, September 1985).
Donald A. Dixon, Merrill Vargo, and Davis W . Campbell, Illiteracy In California: Needs, Services & Prospects (Sacramento: California State Department of Education, 1987).
Irwin S. Kirsch, Ann Jungeblut, Lynn Jenkins, and Andrew Kolstad, Adult Literacy in America: A First Look at the Results of the National Adult Literacy Survey (Washington, DC: National Center for Education Statistics, 1993).
Southern California Rapid Transit District, Southern California Rapid Transit District 1986 On-Board Survey (Los Angeles: Market Research Associates, 1986).
Michael Southworth, “City Learning: Children Maps and Transit,” Children’s Environments Quarterly, Vol. 7, No. 2, 1990.
Michael Southworth and Susan Southworth, Maps: A Visual Survey and Design Guide (Boston: New York Graphic Society/Little Brown, 1982).
Michael Southworth and Susan Southworth, “Oakland Explorers: A Cultural Network of Places and People for Kids-Discovery Centers,” (Berkeley: Institute of Urban and Regional Development, Working
Paper 518, 1990).
Michael Southworth, “SmartMaps for Advanced Traveler Information Systems Based on User Characteristics,” 1994. UCTC No. 236.