What costs are involved in motor vehicle transportation? Many people consider only the dollars they spend on cars, maintenance, repair, fuel, lubricants, tires, parts, insurance, parking, tolls, registration, and fees. But motor vehicles cost society much more than what drivers spend on explicitly priced goods and services.
There are also “bundled” costs, which aren’t explicitly priced but are bundled into the prices of other items. For example, “free” parking at a shopping mall is unpriced to shoppers, but it’s not costless; the cost is included, or bundled, into the prices of goods and services sold at the mall.
Further, there are public-sector costs. Government incurs huge expenses every year to build and maintain roads and provide services, such as police and fire protection, judicial and legal services, environmental regulation, energy research, and military protection of oil supplies.
Beyond these monetary public- and private-sector expenditures are the nonmonetary costs of motor-vehicle use – costs that aren’t valued in dollars in normal market transactions. These include air pollution, personal injury damages from accidents, and travel time. Some of these nonmonetary costs, such as pollution, are externalities, that is, they affect people other than the driver. Others, such as travel time, are what we’ll call “personal” nonmonetary costs.
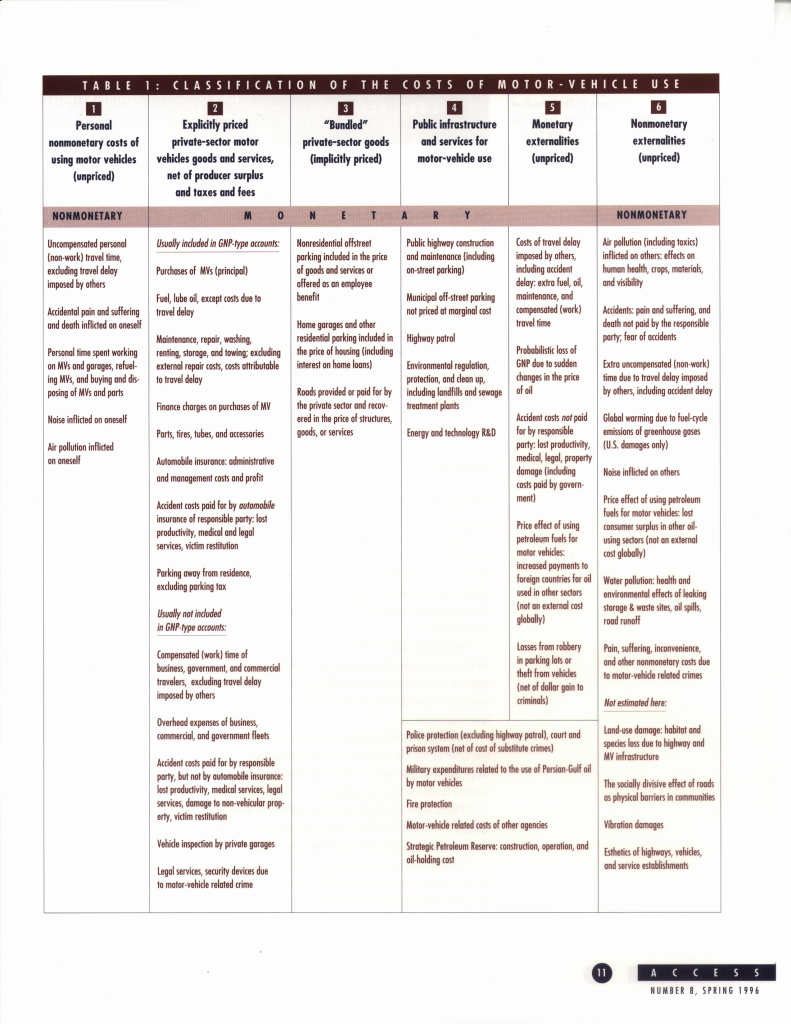
The all-inclusive economic cost to society of using motor vehicles is the sum of all costs mentioned above: explicitly priced private- sector costs, bundled private-sector costs, public-sector costs, external costs, and personal nonmonetary costs. (See Table 1.)
Purpose Of A Social-Cost Analysis
Researchers use social-cost analyses to support many different purposes and policy positions. Some use them to argue that motor vehicles and gasoline are greatly underpriced; others, to downplay the need for drastic policy intervention.
By itself, a total social-cost analysis cannot say whether motor-vehicle use is good or bad, or better or worse than some alternative, or whether it is wise to tax gasoline, restrict automobile use, or travel in trains. Rather, such an analysis is just one of many factors that may enlighten the transportation debate.
Specifically, a social-cost analysis can help:
- Estimate efficient prices for roads, emissions, and other costs. It can estimate the gap between current prices (which may be zero, as with emissions) and theoretically optimal prices. It can help us create policies to narrow the gap and thus use transportation resources more efficiently. However, unless an analysis is done with extraordinary specificity and with an eye to pricing, it can’t determine the precise optimal prices for any motor-vehicle cost.
- Evaluate the costs of alternative transportation investments. A social-cost analysis may help find the alternative that will provide the highest net benefits to society. But it remains only half of the full social-cost-benefit analysis needed to make defensible investment decisions.
- Set priorities for efforts to reduce transportation costs. Detailed comparison of costs can help policymakers decide how to fund research and development to reduce transportation costs. For example, when funding research on the sources, effects, and mitigation of pollution, it’s useful to know that emissions of road dust are probably more costly than are emissions of ozone precursors, which in turn are more costly than are emissions of toxic air pollutants.
Conceptual Framework
In this study, the “social cost of motor-vehicle use” refers to the annualized total cost of motor vehicle use, based on 1990-1991 cost levels, which equals the sum of the following:
- operating costs-including those for fuel, vehicle and highway maintenance, salaries of police officers, travel time, noise, injuries from accidents, and pollution; and
- the value of all capital-including cars, highways, parking lots, garages, and other items that have a useful service life lasting more than a year, converted into a flow of equivalent annual costs over the life of the capital.
This annualization approach is essentially an investment analysis, or project evaluation, in which the “project” is the entire motor-vehicle use system. Of course, it is awkward to treat the entire system-every car, every gallon of gasoline, every mile of highway – as a project to be evaluated. However, comprehensive accounting is necessary to generate data and methods for estimating the social cost of all motor-vehicle use.
What Counts As a Cost Of Motor-Vehicle Use?
In economic analysis, “cost” refers to “opportunity cost.” The opportunity cost of an action is the opportunity one forgoes –what one gives up, uses, or consumes – as a result of doing it. For a resource to count as a cost of motor-vehicle use, a change in motor-vehicle use must result in a change in that resource. Thus, gasoline is a cost of motor-vehicle use because a change in motor-vehicle use causes a change in gasoline use, assuming all else equal. Conversely, general spending on social security or education is not a cost of motor-vehicle use because a change in motor-vehicle use will not induce a change in resources devoted to social security or education.
For purposes of planning, evaluating, or pricing, one must consider not only whether something is a cost of motor-vehicle use, but also, if it is a cost, exactly how it relates to motor-vehicle use. For example, pollution is a direct, immediate cost of motor-vehicle use. But defense expenditures in the Persian Gulf, if they are costs of motor-vehicle use at all, are only indirect, long-term, and tenuous ones. This distinction is important because costs that are tenuously linked are harder to model and estimate. They often lag behind changes in motor vehicle use and depend on the specific characteristics and amounts of those changes.
Costs Versus Benefits
In this project, we estimate the dollar social cost but not the dollar social benefit of motor-vehicle use. Of course, we have not forgotten that there are benefits of motor-vehicle use, nor have we presumed that the benefits are somehow less important than the costs of motor-vehicle use. Rather, we know of no credible way to estimate all benefits and do not attempt to do so. Indeed, motor-vehicle use provides enormous social benefit and, in our view, probably greatly exceeds the social cost.
Because ours is a cost analysis only, we decline to comment on net dollar benefits or cost-benefit ratios, and on whether a particular transportation system is “worthwhile,” or better or worse than another system. For example, our analysis indicates that motor-vehicle use may cost more than people realize. But, even if so, this does not mean that motor-vehicle use costs more than it’s worth, or that we should prefer a transportation option that has near-zero external costs, or a transportation option that has lower total social costs. Those determinations would require estimating the dollar value of all benefits in addition to the dollar value of all costs.
Average Cost Is A Poor Indicator Of Marginal Cost
Any social-cost estimate must reflect the real-world. Thus, there’s no utility in a social cost estimate that tells us what we’d save if we had no motor-vehicle system at all.
But an estimate of the annualized cost of the entire system can be useful if it is scaled down to a realistic “project size.” That is, if the cost of a proposal to increase the motor-vehicle use system by ten percent is approximately ten percent of the cost of the entire system, the gross estimate would be a useful starting point for evaluating the proposal.
Do costs have such a linear relationship with use? In most cases, probably not. For example, we know that nonmarket costs of air pollution are a nonlinear function of motor-vehicle pollution and that congestion delay costs are a nonlinear function of motor-vehicle travel. Most costs of motor-vehicle use do not vary directly with use, down to the mile or gram or decibel or minute. Still, the data and methods used in a total social-cost estimate may be useful in marginal analyses, and the results may help in tracking trends and setting priorities for research.
Classification Of Cost Components
In Table 1, I group the costs of motor-vehicle use according to how efficiently they are priced and allocated. For example, there are costs that are unpriced but perhaps efficiently allocated (“personal nonmonetary costs”), costs that are priced explicitly but not necessarily optimally (“private-sector costs”), and costs that are unpriced and inefficiently allocated (“externalities”). I also consider whether a cost is valued in dollars in real markets-that is, whether it is monetized, such as gasoline or parking, or nonmonetized, such as air pollution. This distinction is important methodologically because nonmonetary costs are much harder to estimate.
Description Of Components
Column 1: “Personal” nonmonetary costs. “Personal” nonmonetary costs are self-imposed, unpriced costs that result from the decision to travel. The largest of these are travel time during uncongested conditions and the risk of getting into an accident caused by oneself.
These costs will be inefficiently incurred if people do not fully recognize them. True marginal-use value may not equal true marginal consumer-cost, and people may drive more or less than they would if fully informed. For example, people may underestimate the chance that they’ll fall asleep at the wheel and thus make trips despite the high risk of getting into accidents.
Column 2: Private-sector goods and services. The economic cost of motor-vehicle goods and services supplied in private markets is the value of resources allocated to supplying vehicles, fuel, parts, insurance, and other items. In principle, an estimate of the private-sector resource cost should exclude taxes paid (taxes are a transfer from consumers or producers to the government) and any revenues exceeding a normal economic profit (such excess revenues are a transfer from consumers to producers).
Prices and quantities in private markets are rarely optimal, not only because of distortionary taxes and fees, but also because of poor information, externalities, and imperfect competition, standards, and regulations affecting production and consumption.
Column 3: Bundled private-sector costs. Some very large costs of motor-vehicle use are not explicitly priced. Foremost among these are the costs of free nonresidential parking, home garages, and local roads provided by private developers. However, all are included in the price of “packages,” such as houses and goods that are explicitly priced.
This bundling is not necessarily inefficient: In principle, a producer will bundle a cost, instead of pricing it separately, if the cost of collecting a separate price exceeds the benefit. In a perfect market, one would expect any observed bundling to be efficient, and that forcing unbundling would be inefficient.
Thus, the question is whether taxes or regulations (such as parking-space requirements) or any other factor is distorting the decision to bundle, and whether suppliers are correct in their assessments of the costs and advantages of bundling.
Column 4: Public infrastructure and services for motor-vehicle use. Government provides much infrastructure and service that support motor-vehicle use. The most costly item is the capital of highway infrastructure. Government costs are treated as a separate group because they are generally priced inefficiently or not at all.
Note that, whereas all government expenditures on highways and the highway patrol are a cost of motor-vehicle use, only a portion of other government expenditures-such as those for local police, fire, corrections, jails-are similarly incurred exclusively for motor-vehicle use. We have estimated the portion of government expenditures that can be attributed to motor-vehicle use as economic costs, such as the cost of police protection to combat motor-vehicle-related crime.
Column 5: Monetary externalities. Some costs of motor-vehicle use are valued monetarily at some point, yet remain completely unpriced for the responsible motor-vehicle user; hence they are external costs. The clearest example is accident costs paid by those not responsible for the accident. Vehicular repair costs inflicted by uninsured motorists clearly are unpriced from the perspective of the uninsured motorist yet valued explicitly in private markets. The largest costs in this category, “monetary externalities,” are the costs of accidents and travel delay.
Column 6: Nonmonetary externalities. A nonmonetary externality is a cost or benefit imposed on person A by person B, but that is not accounted for by person B. Environmental pollution, traffic delay, uncompensated personal injury damages from accidents, and the loss to Gross National Product (GNP) owing to sudden changes in the price of oil are common examples of externalities.
*This is the dollar cost per each of the 188.6 million motor vehicles (including heavy-duty tracks, buses, motorcycles, and publicly owned vehicles) registered in the U.S. in 1990-1991. I present this only to give an idea of the magnitude of the costs. One definitely should not infer from this presentation that: (1) any particular cost/vehicle is the same for all vehicle types; (2) costs are proportional to the number of vehicles; or (3) the most efficient way to address externalities is to raise the price of a motor vehicle.
Limitations On Using Results
Table 2 summarizes the costs in the six categories in Table 1 and provides a separate estimate of user tax payments for motor-vehicle use. But I must caution against several common misuses of these kinds of estimates.
First, one should resist the temptation to add up all unpriced costs and express the total as dollars per gallon of gasoline, as if the optimal strategy for remedying every inefficiency is simply to raise the gasoline tax. The optimal pricing strategy is considerably more complex. Some sources of inefficiency, such as imperfect competition and distortionary income tax policy, are not externalities and therefore are not properly addressed by taxation.
Moreover, there is not a single external cost, with the possible exception of vehicular CO2 emissions, that in principle is best addressed by a gasoline tax. For example, an optimal air-pollution tax would depend on the amounts and kinds of emissions, ambient conditions, and the size of the exposed population. It would not be proportional to gasoline consumption.
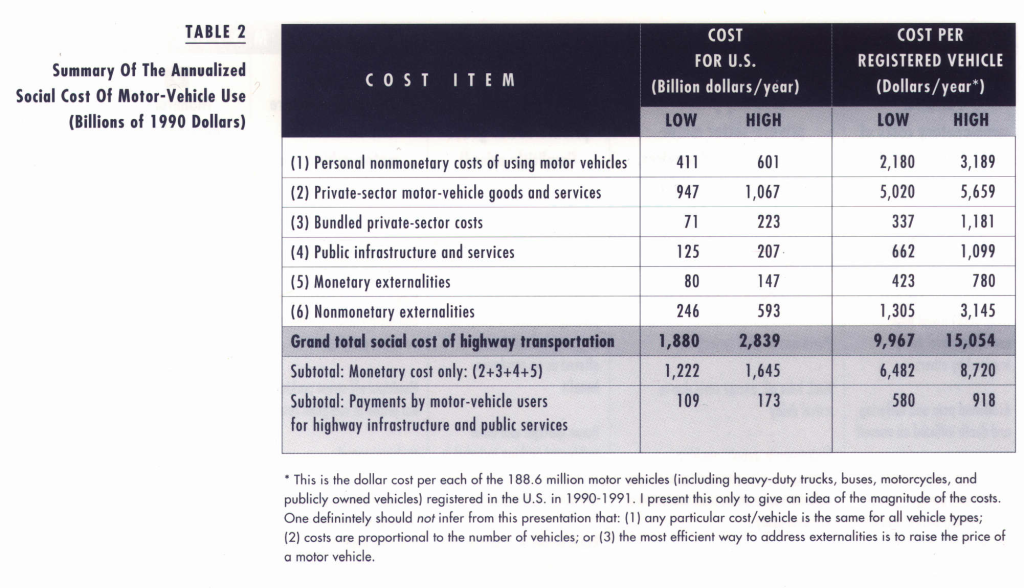
Second, it is misleading to compare the total social cost of motor-vehicle use with the GNP of the United States. GNP accounting is quite different from and conceptually more limited than our social-cost accounting. For example, GNP does not include nonmarket items such as air pollution.
Third, there is considerable uncertainty in these social-cost estimates. Among other things, we do not estimate every conceivable component oreffect of every cost, nor do we accommodate the entire span of data or opinions in the literature.
Fourth, it is not economically meaningful to compare our estimates of user tax and fee payments with our estimate of government expenditures. I emphasize that it simply isn’t true that any difference between payments and expenditures is a source of economic inefficiency. This is because efficiency does not require that government collect from users revenues sufficient to cover costs.
Finally, ours is an analysis of the total social cost of motor-vehicle use. Any particular policy or investment decision involves costs incremental or decremental to the total. Therefore, you should not use our average-cost estimates in marginal analyses unless you believe that the total-cost function is almost linear and, hence, that any marginal-cost rate is close to the average rate.
Further, our results will be less and less applicable as one considers times and places increasingly different from the United States in 1990 and 1991. However, even if our results per se may become irrelevant, these data, methods, and concepts may nevertheless be useful when analyzing specific pricing policies or investments.
Summary
We have classified and estimated the social costs of motor-vehicle use in the United States based on 1990-1991 data. Our analysis is meant to inform general decisions about pricing, investment, and research. It provides a conceptual framework for analyzing social costs, develops analytical methods and data sources, and presents some initial detailed estimates for some of the costs.
A social-cost analysis cannot tell us precisely what we should do to improve the motor-vehicle system. There are several kinds of inefficiencies in the system, along with several kinds of economically optimal measures. Moreover, measures to improve economic efficiency are only part of the solution because our society cares as much about equity, opportunity, and justice as it does about efficiency. Ultimately, a total social-cost analysis contributes only modestly in determining efficiency, which is just one of several societal objectives for transportation.
Further Readings
The Institute of Transportation Studies (UC-Davis) and UCTC are publishing twenty reports that underlie the summary presented here.
- The Annualized Social Cost of Motor-Vehicle Use In the U.S., 1990-1991: Summary of Theory Methods, Data, and Results
- Some Conceptual and Methodological Issues In the Analysis of the Social Cost of Motor-Vehicle Use
- Review of Some of the Literature on the Social Cost of Motor-Vehicle Use
- Personal Nonmonetary Costs of Motor-Vehicle Use
- Motor-Vehicle Goods and Services Priced In the Private Sector
- Motor-Vehicle Goods and Services Bundled In the Private Sector
- Motor-Vehicle Infrastructure and Services Provided by the Public Sector
- Monetary Externalities of Motor-Vehicle Use
- Summary of the Nonmonetary Externalities of Motor-Vehicle Use
- The Allocation of the Social Costs of Motor-Vehicle Use to Six Classes of Motor Vehicles
- The Cost of the Health Effects of Air Pollution from Motor Vehicles
- The Cost of Crop Losses Caused by Ozone Air Pollution from Motor Vehicles
- The Cost of Reduced Visibility Due to Air Pollution from Motor Vehicles
- The External Cost of Noise from Motor Vehicles
- U.S. Military Expenditures to Protect the Use of Persian-Gulf Oil for Motor Vehicles
- The Contribution of Motor Vehicles to Ambient Air Pollution
- Payments by Motor-Vehicle Users for the Use of Highways, Fuels, and Vehicles
- Tax Expenditures Related to the Production and Consumption of Transportation Fuels
- Some Comments on the Benefits of Motor-Vehicle Use
- References and Bibliography

