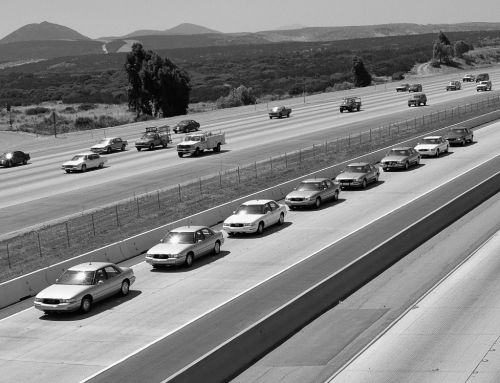
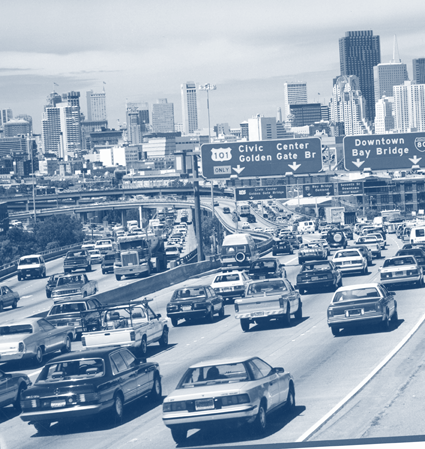
 Before leaving for work you can check the weather from the newspaper, radio, or TV report. You can just look at the sky and make your own guess. But you can’t determine much about current traffic conditions. TV and radio traffic reports provide only a summary (“traffic is running smoothly this morning”) and spotty coverage of incidents (“an accident in the second lane has been cleared”). If you are unexpectedly stalled in traffic, your frustration and anxiety mount. You don’t know how long you’ll be stuck or whether you should use your cell phone to cancel your appointment.
You need a service that tells how long you can expect your journey to take if you leave right now or wait for fifteen minutes. You’d love to have this information available on the web, where you could collect if from your computer at home or work or even from your car phone. The service is not available for you today; but it will be very soon. A Berkeley group, in cooperation with Caltrans and the California PATH program, has developed a prototype computer system that provides this service for Orange County; the plan is to extend coverage to all freeways in California within the year. And the system, called PeMS (Performance Management System), can do much more than just calculate your trip time.
Until now, there has been no way of knowing how efficiently the freeway system is operating. But with PeMS, traffic engineers can analyze whether control equipment (such as ramp metering) is being used effectively and can then adjust settings accordingly. They can track the most frequently congested freeway segments. They can quickly determine the effects of lane closures. Using PeMS, these analyses can be done in minutes or hours. Without PeMS, such studies would take months, and so they aren’t undertaken.
For the first time the director of a Caltrans district can, at the click of a mouse, obtain an objective, quantitative comparison of the daily performance of different parts of the freeway system. Poor performance can be diagnosed and corrected. Analyses can identify freeway bottlenecks, so resources can be allocated to clear incidents quickly and thus prevent congestion from choking them again.
Transportation planners can use PeMS to observe traffic and determine whether performance can be improved by making adjustments, or whether new capacity has to be built.
Policy makers and the public can use PeMS to get a quantitative grip on “the transportation problem.” They can see where congestion is frequent; how much it costs in terms of delay; whether HOV lanes are effective; where traffic growth is greatest. PeMS is also designed to incorporate data from local roads and transit. If such data become available, PeMS would be able to provide objective appraisals of different transportation systems and modes within a metropolitan area.
How Does it Work?
PeMS relies on data feeds from traffic surveillance equipment maintained in the field by Caltrans and other transportation agencies. Buried under freeways in every state, including California, are copper loop detectors. The loops are located in most urban areas at approximately a third of a mile apart in every lane and at entrance ramps and exits. There are lots of these detectors. Orange County has 4,000 loops, and the largest district, Los Angeles, has several times as many. You can spot a loop in the free- way by a six-foot rectangular, diamond-shaped or circular outline in each lane across the freeway which seals a cut in the pavement made to bur y the loop. Sometimes loops are deployed in pairs separated a few feet apart, in which case they’re called double loops.
 Electric current in a loop changes when a vehicle is directly above it. An electronic circuit detects and records the time when these changes occur. These basic data are then processed to calculate two numbers, called count and occupancy, every thirty seconds. Count is the number of vehicles that cross the detector in a thirty-second period; occupancy is the fraction of time during those thirty seconds that a vehicle is present above the detector. Where there is a double loop, two additional numbers can be calculated: the average speed of the vehicles crossing the loop in thirty seconds, and the average length of those vehicles. All these calculations are routinely carried out in equipment located in a cabinet on the side of the freeway close to the loops.
Every thirty seconds, these data are sent over telephone lines to the district’s Transportation Management Center (TMC). Large volumes of data are generated each day: 100 MB in Orange County, about ten times as much in Los Angeles, twenty times as much in the entire state. No district mines these data for the large amount of useful information they contain—but PeMS does.
As the data are fed from the detectors to the Caltrans Orange County TMC, a copy is shipped over a telephone line to the PeMS computer on the UC Berkeley campus. Software developed at Berkeley works on the data as soon as they arrive. These real-time calculations produce information of use to travelers, traffic engineers, and managers. Additional software works on historical data to record trends, and researchers are continuously developing new software to extract other useful information. Researchers are also developing and improving other traffic monitoring technologies such as video image processing and laser-based systems.
The PeMS computer is called transacct. Its website (http://transacct.eecs.berkeley.edu) provides some general information about PeMS, and it also displays PeMS’s current speed estimate for different parts of the freeway network on a color-coded map of Orange County. (There are no double-loop detectors in Orange County, but an ingenious algorithm can calculate speed from single-loop detectors.) You can also request an account, which allows you to access a great deal of information about the performance of the Orange County freeways. Some of this information is described below.
For the Manager
As manager, you may wish to see aggregate performance measures, either daily or averaged over a long duration. Several measures are available. Caltrans publishes an annual congestion measure of daily vehicle-hours of delay. To estimate this delay, cars equipped with computers that record speed and distance are driven along each section of congested freeways during commute periods twice a year. Aside from being expensive, this is not a statistically sound estimate, because daily variation is very large. In contrast, PeMS calculates this delay over any portion of the freeway network, averaged over any number of days or for each day.
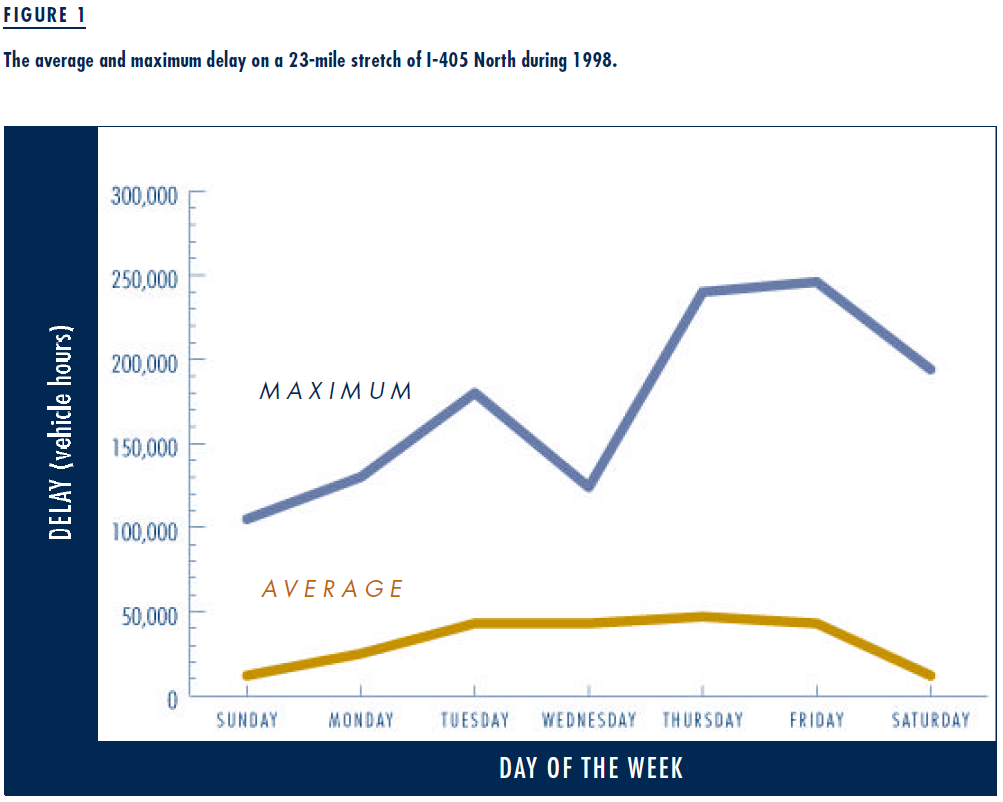
Figure 1 shows the average and maximum delay over a 23-mile stretch of the 405 freeway for each day of the week, averaged over all of 1998. Congestion is lowest on Saturdays and Sundays. On the year’s worst Friday, delay on this freeway was five times longer than the average. As manager, you might insist on finding an explanation whenever the delay reaches a certain point, say when it exceeds the delay during 75 percent of the days in the previous year.
PeMS also calculates a more revealing performance measure than delay, a measure based on the premise that the freeway network produces a service—namely, movement of people and goods. By comparing a freeway’s “output”—vehicle miles traveled (VMT)—and “input”—vehicle hours traveled (VHT)—we can measure its productivity, that is, the speed at which vehicles can travel. (Q = VMT/VHT, with Q being average speed weighted by number of vehicles. The larger Q is, the better the operation of that freeway).
An even better measure of output and input is PMT and PHT, where P stands for persons. We can convert VMT to PMT if we know the average number of people per vehicle. PMT and PHT are good measures for evaluating transit operations and comparing them with freeway operations.
 Data show that during rush hour, as the number of cars increases, speed remains constant until some saturation point is reached, at which time speed quickly drops and stays slow for a long time. Every commuter knows this. More interesting is the fact that the saturation point (or capacity), measured by number of vehicles per hour, is different every day and varies by as much as twenty percent, even in the absence of any accident. It is not known why capacity varies so much—researchers are testing various hypotheses using PeMS data. The manager’s goal should be to achieve the higher capacity. Note that a twenty percent increase is equal to the capacity of one lane on a five-lane highway, so this represents a significant difference.
For the Engineer
When traffic on a freeway link reaches a saturation level, people are stuck in their vehicles (VHT increases and VMT drops). The result is a waste of people’s time, increased frustration, and a large increase in pollution. The ultimate objective of traffic engineering is to increase utilization and capacity and to prevent congestion.
We know that in principle the freeway system can be operated to meet these objectives by the proper control of ramp metering and advisory messages. There is considerable international know-how about good control strategies. These strategies are all in “feedback” form: they specify, say, ramp metering rates as a function of the current state of the network. Thus an essential element in implementing a good strategy is a good estimate of the network’s state. PeMS provides such estimates in real time. Traffic engineers can use PeMS to design strategies, measure their effectiveness, and improve them. PeMS thus has the potential to significantly improve freeway operations.
Considerable effort has gone into producing freeway simulation models. These computer models of traffic take into consideration many parameters representing driver behavior, freeway geometry, trip characteristics, etc. Large amounts of data are needed to calibrate these models with enough accuracy to make them useful for prediction. PeMS makes these data  available in a very convenient form. Simulation models can now be calibrated and tested, which will make them invaluable to traffic engineers. For example, the models could be used to predict the effects of lane closures or of a major event such as a football game; and as shown in recent work at UC Irvine, support advanced, real-time traffic management strategies.
For the Traveler
If you have an account and click the button labeled “Travel time calculation” on the transacct home page, a map of Orange County is displayed. You can then indicate the origin and destination of your trip either by selecting the freeway and cross street from a pull-down menu, or simply by clicking those locations directly on the map. Transacct then computes the shortest time and route for two cases, depending on whether you can use the HOV lanes. If data were available, transacct could also display travel options for transit alternatives.
Algorithms are being developed to predict future trip times (“Tell me the best route if I start fifteen minutes from now”), which combine current estimates with historical trends. It is likely that, if such a service were available, travelers would change their departure times or routes to reduce their trip times. The result would be a “spreading” of the commute peak and a reduction in total delay.
Conclusion
Imagine a company that produces a service for a large market, but does not keep track of how much it produces, or what it costs, or how satisfied its customers are. Such a company would soon go out of business, unless it is a monopoly whose behavior does not arouse the public’s wrath. A transportation agency is like this company: it does not measure the quantity or quality of its product, or how much time and money it costs people to travel over its freeways. It responds when the public or political leaders are particularly agitated. But the public does not have the means to judge how well it performs.
The PeMS project is based on the common sense beliefs that you cannot manage a transportation system today if you don’t know how it performed yesterday, and that the best way to improve the system is to enable everyone to easily figure out how the system is performing every day.
Further Readings
Caltrans, District 4, Office of Highway Operations. 1998 Highway Congestion Monitoring Report.
CORSIM, FHWA’s microscopic traffic corridor simulation.