[sharelines]Census undercounts can miss out on important groups, particularly low-income and minority households.
 The decennial census is America’s single most important effort to collect data on its population, and yet the count always comes up short. Over the years, the counts have been getting somewhat better, although it’s still nearly impossible to include everyone. Estimates of the uncounted population declined steadily from 5.4 percent in 1940 to 1.2 percent in 1980, then increased to 1.8 percent in 1990. Preliminary estimates for 2000 range from 0.96 to 1.4 percent.
One troubling aspect of the undercount is the sizable variation among groups—what’s called the “differential undercount,” because groups are undercounted differently. Preliminary estimates for the 2000 census show undercount rates for minorities that are several times higher than rates for non-Hispanic whites—three times higher for African Americans, four times higher for Hispanics, and seven times higher for American Indians on reservations. Undercount rates also vary by region, level of urbanization, and home ownership.
It’s still too early to estimate differential undercount rates for commuters in 2000, but we do have data for 1990 that are probably indicative of the 2000 patterns. Estimated 1990 undercount rates in 22 metropolitan areas were 1.3 percent for solo drivers, 2.2 percent for carpoolers, 2.3 percent for pedestrians and bicyclists, and 3.2 percent for mass-transit riders—two and a half times the undercount rate for solo drivers. This is not surprising, given that minorities and low-income workers are disproportionately over-represented among mass-transit riders.
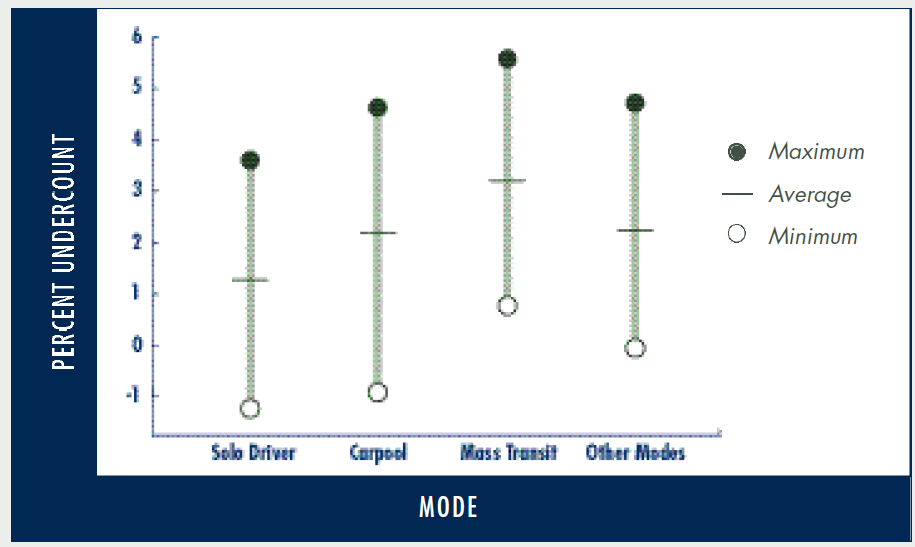
Figure 1: Mode
Figure 1 shows the ranges in undercount rates among the 22 metropolitan areas. Pittsburgh, Philadelphia, and Boston had the lowest; Houston, Miami, and Los Angeles had the highest. Variations across metropolitan areas reflect both socioeconomic differences within labor forces and differences in distributions of income and ethnic groups. Moreover, there was variation in differential undercount rates across transportation modes. They were higher for mass-transit riders than for solo drivers in all 22 metropolitan areas, but the size of the gap varied. For example, Newark had the largest, a gap of 2.7 percentage points, but in Seattle the undercount difference was only 1.4 percentage points.
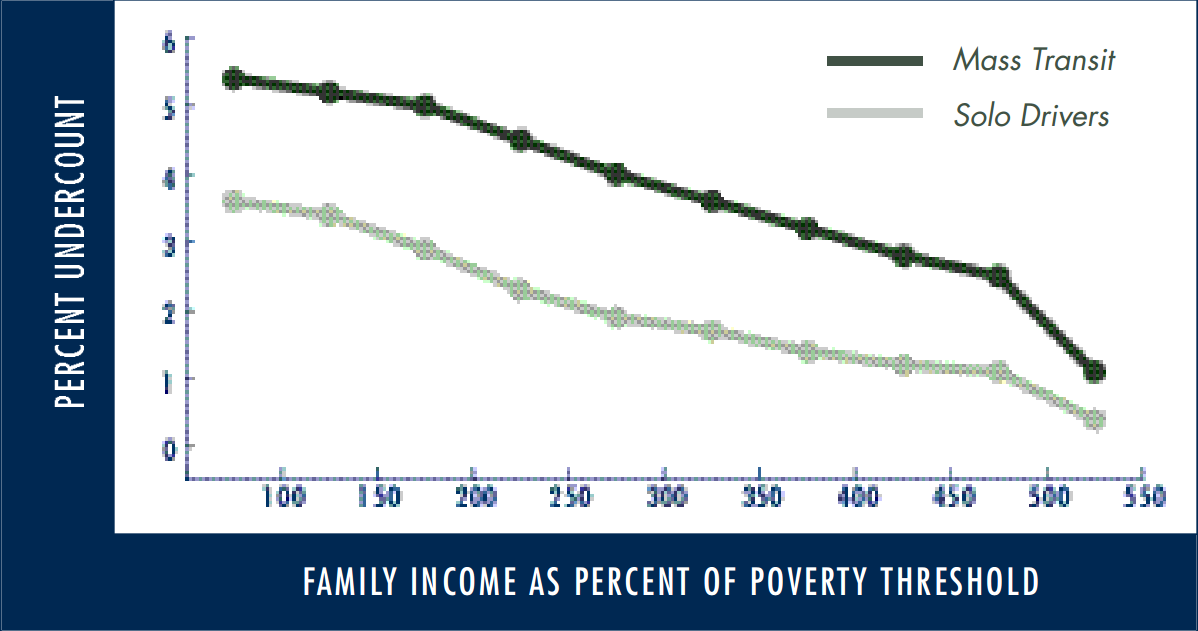
Figure 2: Income Level
Figure 2 shows estimated undercount rates by income level for mass-transit riders and solo drivers. As expected, undercount rates varied inversely with rising incomes, approaching zero at the highest income levels; and they varied directly with percentage of minorities, as depicted in Figure 3.
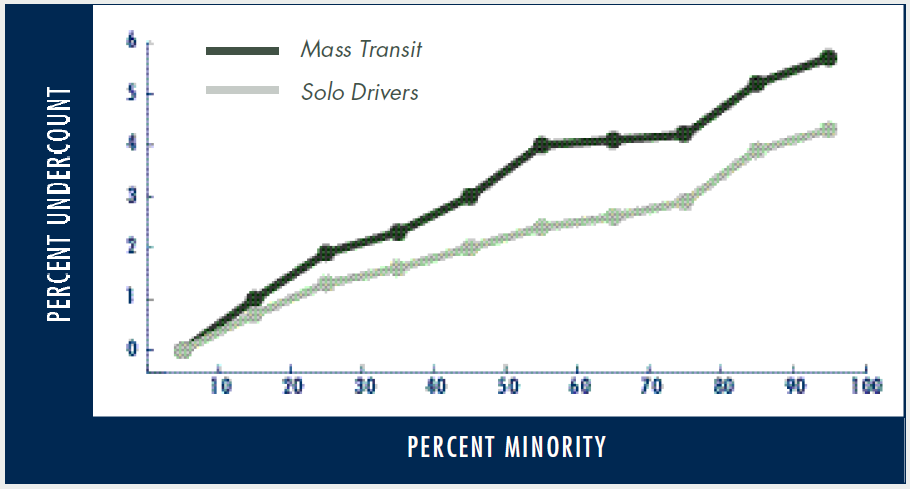
Figure 3: Minority Population
The absence of accurate data on low-income and minority commuters can distort transportation policy and financial allocations. Planners are unable to accurately assess transportation needs when the number of people who rely on transit for access to employment in miscounted. Unintentionally and systematically, they are likely to underestimate the importance of public transportation relative to private transportation, leading to inadequate support for mass transit.
The degree of distortion in transportation policies will depend on how the differential-undercount problem is addressed. Accurate statistics on commuters, their demographic characteristics, and the ways they travel to work are prerequisite to sound transportation plans and a fair allocation of public resources among modes. In turn, access to the required information calls for statistical corrections to ensure that commuter data from the 2000 Census will include everyone.