California’s Department of Finance predicts that by 2030 the state’s population will reach fifty million people—twelve million more than today. This will result in an estimated 2.7 million new households in the state. How should the state allocate resources to house the new population, and how will choices made today affect the state’s economic, social, and environmental performance in the future?
In many urban centers, low-and-moderate income households live with home prices and rents that far outstrip basic affordability standards.
California has faced two housing-related issues for decades: cost and location. In many urban centers, low-and-moderate income households live with home prices and rents that far outstrip basic affordability standards. Even upper income households pay more for housing relative to their income in California than in most other parts of the US. And what new affordable housing there is has largely been added in nonurban places and at urban peripheries, resulting in steadily increasing traffic congestion and commute times in the state’s urban areas.
The housing “crash” of recent months might lead to the expectation that California’s housing problems are ending. However, although plummeting home prices and home sales may provide some breathing room in a very tight market, larger issues remain regarding where housing is built, how related infrastructure is financed, and who can afford to live in and move into the state.
California’s Housing Supply
With home prices falling and subdivisions standing empty, it is hard to argue that California does not have enough total housing stock. New housing construction has been fairly strong since 2000. California housing stock grew from 12.2 million in 2000 to 13.3 million in 2007, an increase of about 1.1 million homes, or 9 percent. The number of households grew by 8.9 percent.
Housing and households lagged behind population, which grew by 11.2 percent from 2000 to 2007. This is at least in part due to differences in household size and growth rates by ethnicity; the Hispanic population, which has traditionally had a larger average household size than other groups, has grown faster than other population cohorts in California. During periods of strong population growth, California has had low rental and homeowner vacancy rates. In 2004, only Vermont and New Hampshire had lower rental vacancy rates than California; the state also had the third lowest homeowner vacancy rate (less than one percent) of states with populations of five million or more.
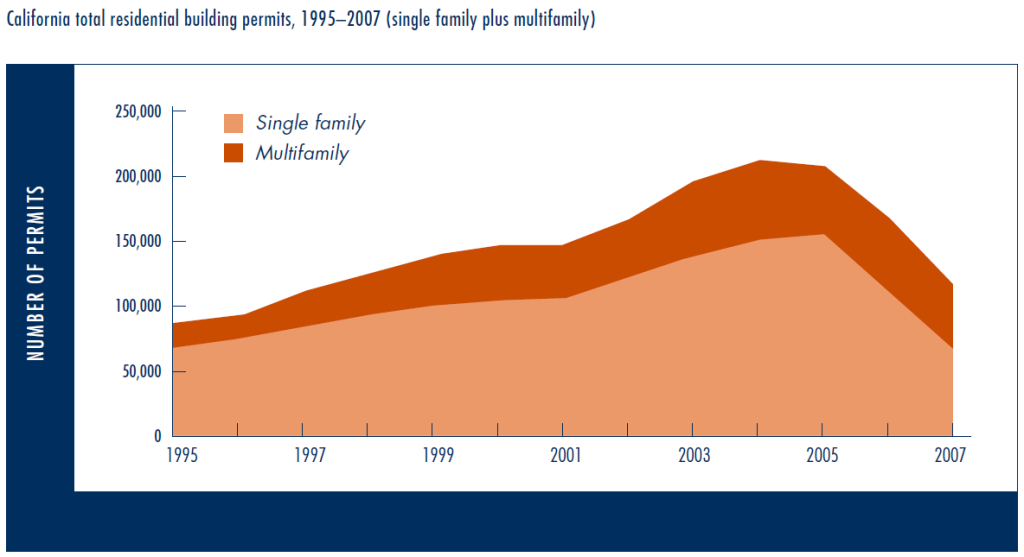
By 2007, California’s rental vacancy rate had eased only slightly, but the homeowner vacancy had moved much closer to the US median. Strong residential building activity since 2000 contributed to this change. In 2004 and 2005, California single-family residential building permits reached their highest level since 1989 (see Figure 1). In the past two years this construction level has declined. The current low rental vacancy rate suggests that the building boom of the mid-2000s was not sufficient to overcome shortfalls in rental housing that built up in the 1990s.
Figure 1
High Costs and Limited Affordability
California housing costs are far higher than the nationwide average. Figure 2 shows that California median home prices were almost 2.5 times the national level in 2007, and San Francisco Bay Area prices were more than three times the US level. Quality of life, the global housing market affecting some of the state’s major urban centers, and constraints on adding new supply all contribute to this difference. Rental differences are less extreme, although gross rent for Californians is 35 percent higher than national levels. California household median incomes are higher than US median incomes by 17 percent, not nearly enough to outweigh the higher costs of buying a house.
Statewide, Californian renters pay on average 32 percent of their household income on rent, compared to 30 percent nationally. This seems like a small difference, but it masks the significantly higher shares of low-to-moderate income workers who pay more than 35 percent of their household income for rent (as shown in Figure 3).
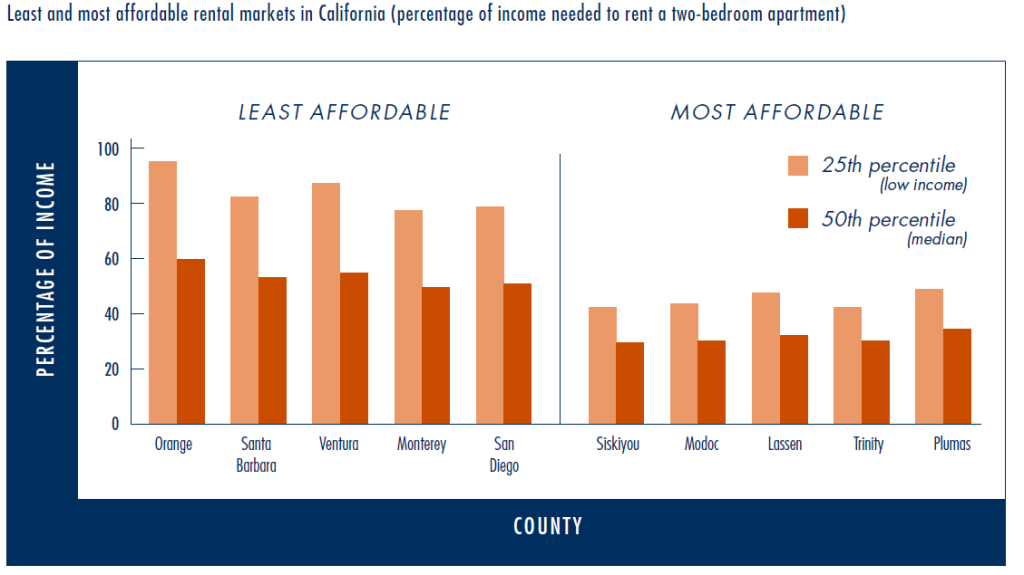
The rental housing situation varies widely among counties. Detailed data is not available for many counties, so we use a modified version of a rental affordability measure developed by the California Budget Project in Locked Out 2004. We examine how much of their income full-time workers at the median wage level and at the 25th percentile wage level must pay to afford a fair market rent in each county. The least affordable counties are coastal urban markets where job growth has been strong and supply constrained by factors such as growth controls, water requirements, land availability, congestion management, habitat and coastal protection, and homeowner protests. The most affordable are north central nonmetropolitan counties with limited employment opportunities and fewer supply constraints (see Figure 4).
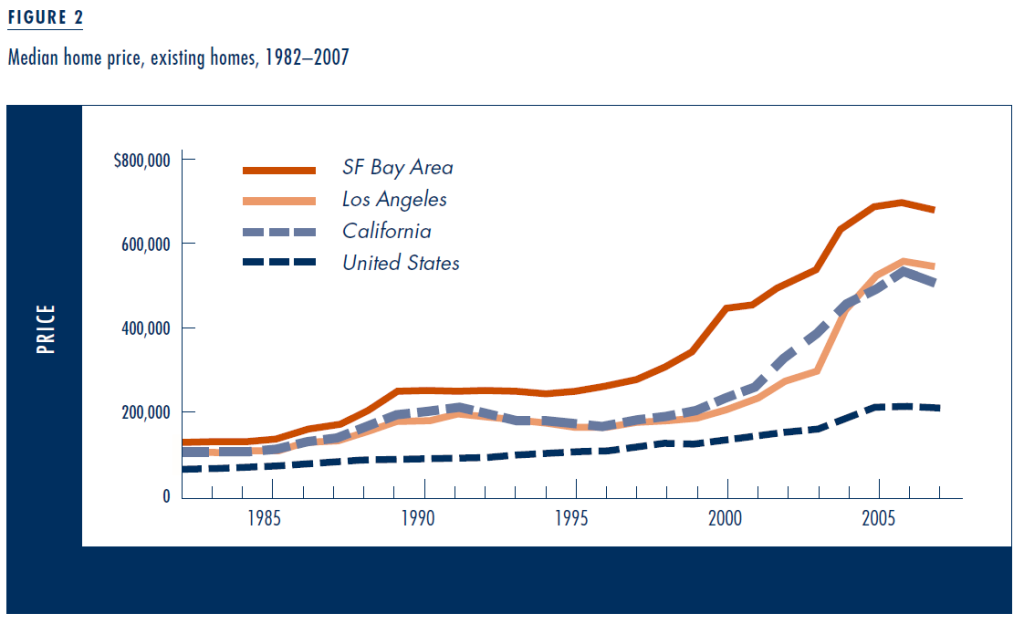
Figure 3
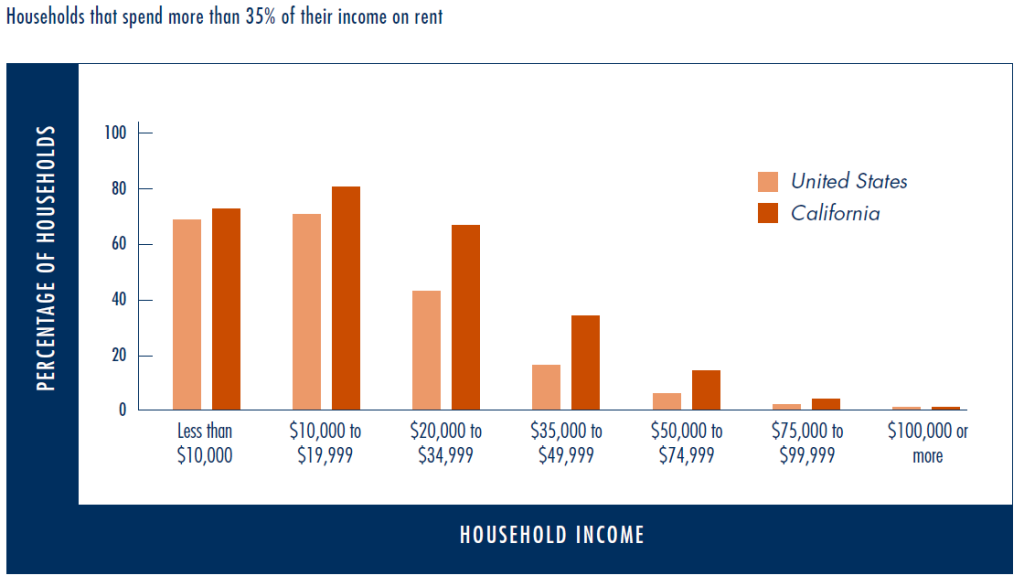
Figure 4
The Mortgage Meltdown and California Housing
National economic and policy factors have also helped push the housing market into its current condition. The ready availability of credit for home buying during the past decade certainly affected the California market. The homeownership rate rose from close to 55 percent in the mid 1990s to over sixty percent in 2006. California home values rose an average of ten to eleven percent annually from the first quarter of 1995 to the middle of 2006. The first three of those years involved price recovery from the previous recession, but over ninety percent of the growth occurred after 1998. While home prices in California have recently dropped, state prices are still well above the national average. (Even if prices were to drop thirty percent, there would still be a large cost gap between California and the rest of the US.)
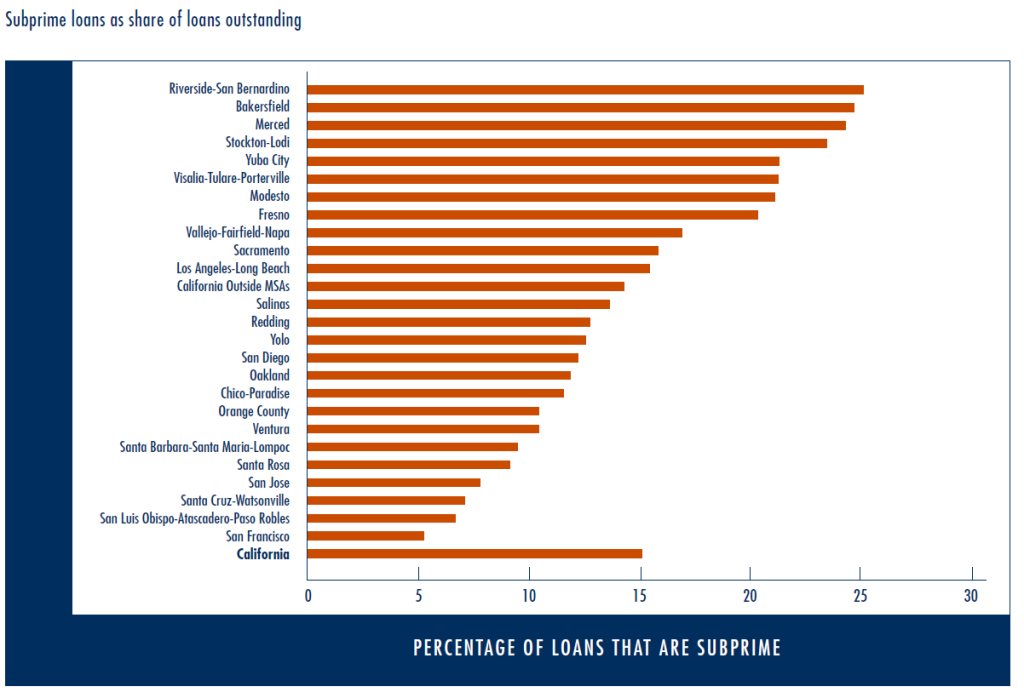
California is more heavily exposed to the subprime problem than many other parts of the US. Of all outstanding home loans in California in December 2007, 15.4 percent were subprime loans, compared to 12 percent nationwide. Almost thirty percent of California’s subprime loans were delinquent at least sixty days in December 2007. The more affordable parts of the state had a higher share of subprime borrowers, and now face higher levels of default and foreclosure (see Figure 5). Many of the more expensive areas in the state have been much less affected by both exposure to the problem (in terms of the share of subprime loans) and current levels of defaults and foreclosures. Thus this crisis, at least for the present, is skewing home prices by lowering them further in the more affordable markets, rather than where prices are highest.
Jobs- Housing Balance and the Commute Connection
Where people live in relationship to their jobs determines not only the length of their commutes, but the modes they choose, how much time they spend traveling, their commute costs, and environmental consequences of their travel. Traffic congestion increases and commutes lengthen as people move farther from their work because housing growth and affordable housing have failed to keep up with demand generated by population and employment growth. One way to look at the relationship between job growth and housing growth is by examining the jobs/housing balance.
Figure 5
If we only consider statewide averages, it might seem that California is doing well on this measure. Because California lost jobs or experienced very low employment growth between the third quarter of 2001 and the fourth quarter of 2003, state housing growth looks good relative to job growth: California added 1.7 housing units for every new job between 2000 and 2006. Since California’s households have an average of 1.3 workers, this seems a more than adequate ratio of housing construction to job creation.
However, the picture is more complicated at the county or metropolitan area level. Some counties with job losses or slow employment growth have improved their housing situation. For example, between 2000 and 2006, the San Francisco Bay Area still had not regained jobs lost before 2000, but added almost 135,000 housing units. Los Angeles County added 4.6 housing units for every new job. But other urban areas where job growth was strong did a much poorer job of meeting housing need. San Diego County added only 0.75 housing units per job, and Orange County only 0.38 housing units per job.
In contrast, a number of Central Valley places added more housing than jobs in anticipation of growing demand. San Joaquin, Stanislaus, and Merced counties exemplify the spread of relatively affordable housing to (or beyond) the periphery of a metropolitan area, in this case the San Francisco Bay Area, to serve existing jobs in the core metro area as well as expected job growth in the future. These areas are now ground zero of the subprime meltdown. Meanwhile, traffic congestion has grown in all California metropolitan areas, and those areas where housing growth lagged behind job growth have experienced the biggest increases in congestion (see Figure 6).
Our research shows that housing costs are higher where there are fewer housing units per job. Even strong housing development can fail to make housing more affordable if it does not keep pace with even stronger job and household growth. For example, the Riverside and San Bernardino areas grew their housing supply between 2000 and 2007, but the job supply grew even faster, and the number of households grew faster than housing units. Both counties have high rents relative to wage levels, due to a combination of relatively few multifamily units and relatively low wages compared to other parts of the state.
Not surprisingly, at the more expensive end of the housing market, the problems are worse. Ventura and Orange counties, with the least affordable housing in the state, have low housing-to-job ratios, and housing construction has been lagging behind job and household growth.
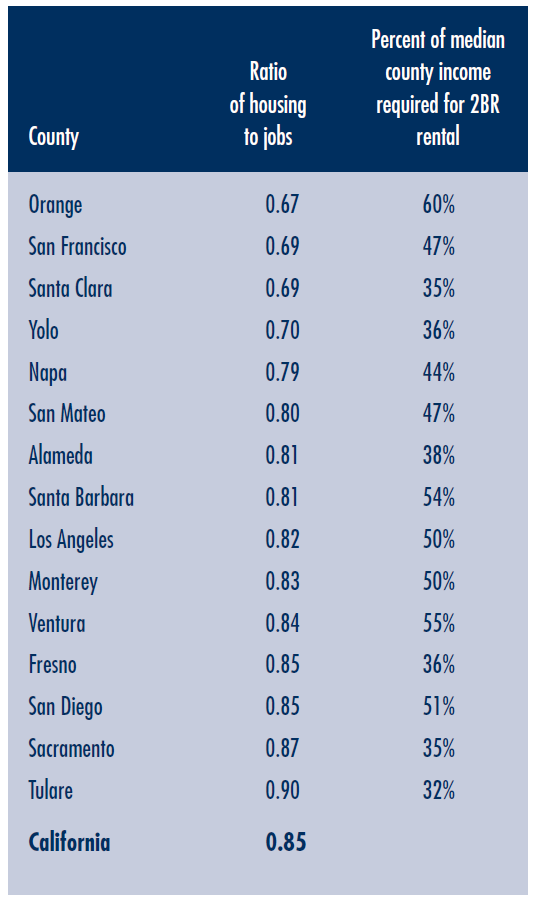
Figure 7 shows which counties had the lowest housing-to-jobs ratios in 2006 as well as how much of the median gross income was needed to afford a two-bedroom rental in the county. The counties topping the lists for low housing-to-job ratios and high percentages of income needed for rent should be top priority for affordable housing policies and implementation. Counties with somewhat low housing-to-job ratios and moderate price levels (such as Yolo or Sacramento) could become less affordable if housing production were to slow down and job growth continue. In areas that currently have plenty of affordable housing but are seeing very rapid job growth (such as San Benito, in the sphere of the San Jose metropolitan area), public action may be needed to avert problems in the near future.
Figure 6
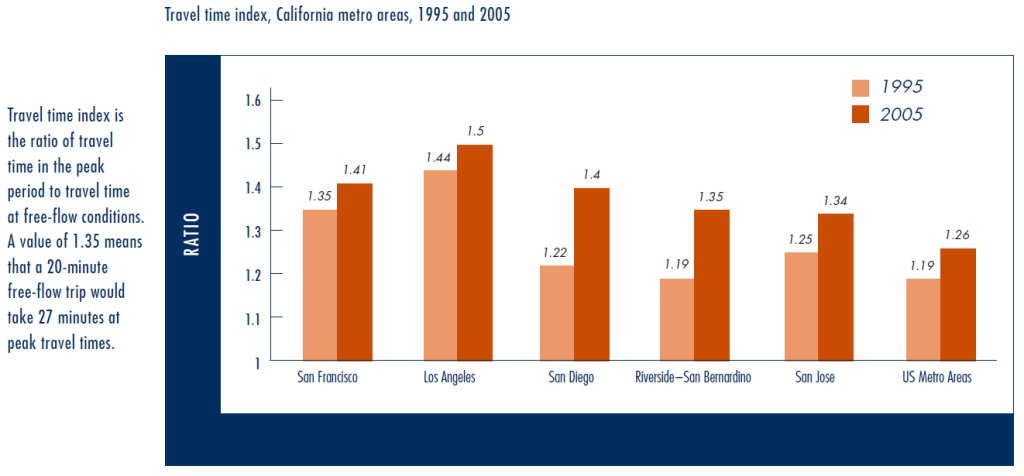
Figure 7
Longer-Term Factors for Housing Policy
Factors other than quantity, affordability, and location play an important role in the type of housing needed now and in the future. Ethnicity and age, for example, affect household size and household location preferences and needs. California expects striking changes in population mix—in terms of race, ethnicity, and the age distribution of household heads. For example, the largest ethnic category by 2030 will be Hispanic (increasing from 32 percent of the population to 45 percent). If the Hispanic population continues to have lower incomes and larger households than other groups, then the need for affordable larger housing units will intensify, but the number of units needed will grow more slowly than the overall population.
At the same time, the percentage of the population 65 and older will increase, and therefore there will be more households headed by retirees. These households will require smaller units at a range of prices that reflect diversity in their income levels. Many elderly will seek out areas that provide proximity or convenient access to health care, personal services, family and friends, and leisure activities; housing demand in those areas will likely increase.
Housing Priorities for the Future
Key findings from our research show where California’s housing policies need to focus. First, affordability—rather than production and supply—is California’s key housing issue. Although low-to-medium wage workers earn more than their counterparts in many other US locations, they pay a higher share of their wages for housing. Large urban areas with low housing-to-job ratios have the greatest affordability problems.
The past ten years have seen significant investments in somewhat denser housing in many of the most expensive parts of California. This has not resolved the affordability problem, because much of the investment has been in high-end units (and skewed toward homeownership rather than rental housing). On the other hand, those locations have seen less of an increase in traffic congestion than other parts of the state. Those areas where suburbs expanded have provided some affordable housing, but at the cost of sharp increases in traffic congestion, household transportation costs, and commute times for their residents. Addressing these issues will require coordination across land development and transportation sectors.
Many local governments face tight operating budgets that lead them to evaluate new developments largely in terms of potential revenue and cost to the city. New construction is expected to pay the marginal costs of new activities (residential and otherwise) resulting from it. As a result, builders tend to focus on more expensive units, since their buyers can better absorb incremental costs associated with fees for roads, sewer and water services, education, and other social services.
Without more coordination, direction, and support from the state level, communities will continue to make decisions on housing construction versus job growth based on immediate effects on the city budget, local opposition to growth, and difficulty in finding land and funding for affordable housing, rather than on longer term cumulative impacts on quality of life, worker availability, commute costs, congestion, and affordability.
These findings point to where California housing priorities should focus. The first priority is affordable housing. Funds for affordable housing should target locations and population groups whose need is greatest—families, low- to-moderate income retirees, and housing types with the tightest supply. Moreover, California must recognize rental housing as a key component of an affordable housing strategy, and rental housing should have priority for bonds and direct assistance to low-and-moderate income families. Some homeownership programs would also be appropriate, but these need to recognize that the transition to homeownership may not be smooth, and must include requirements for education and safeguards regarding financial management.
Affordability—rather than production and supply—is California’s key housing issue.
Second, California should give priority to projects that reduce their “carbon footprints” through design, energy conservation and renewable systems, waste management, and other processes, including supporting transit use and increasing housing supply in redeveloping core urban areas. Such projects will produce both direct and indirect benefits and help the state implement its greenhouse gas laws.
 Third, California must coordinate affordability goals and environmental goals. More affordable housing, including multifamily housing, is a critical component of housing policies that reduce traffic congestion and land use consumption. The “fair share” element of California’s housing planning requirements is beginning to encourage denser and more affordable housing in some parts of the state. Further incentives and perhaps different targets may be necessary to bring about an urban form that provides affordable housing accessible to employment. One alternative would be to allocate affordable housing funding to priority need areas that are implementing plans in compliance with Housing and Community Development fair share requirements.
Other types of support will also contribute to meeting statewide affordability and environmental goals. Communities may need additional technical assistance or non-housing funding, such as redevelopment funds for infrastructure and water, in order to build more housing. Directing bond funds—for parks, transportation, housing, and water resources— to produce sustainable, affordable communities will benefit the state.
These strategies will take place effect in the context of other state, regional, and local policies. Implementation of state laws, including AB 32, add a layer of complexity to decisions balancing affordable housing, transportation, and environmental needs. Blueprint projects in many metropolitan areas provide a context for addressing these multiple elements. A strategic plan that identifies spending priorities and project delivery mechanisms could not only improve California’s housing opportunities but produce a more sustainable future.
Further Readings
California Budget Project. Locked Out 2004: California’s Affordable Housing Crisis. 2004. (accessed January 2008).
California Department of Finance. Raising the Roof: California Housing Development Projections and Constraints, 1997–2020 (Sacramento, California: 2000). (accessed January 2008).
California Department of Housing and Community Development. California Housing Markets 1990–1997. 1998. (accessed April 2008).
Paul G. Lewis. California’s Housing Element Law: The Issue of Local Noncompliance. Public Policy Institute of California, 2003. (accessed April 2008).