Without high patronage, new rail investments incur large deficits and fail to deliver promised environmental and social benefits. A system with few passengers and a high price tag is, by most accounting, a poor investment economically, environmentally, and socially. Comparing the costs and the number of passenger-miles traveled for 54 American rail transit investments since 1970, we found wide variation in cost-effectiveness. The worst-performing system costs nearly 50 times more per passenger-mile than the best-performing. What factors distinguish the most successful transit investments?
Dense concentrations of people and jobs around transit stations are particularly important. Outside of Manhattan, Chicago’s Loop, and a few other urban pockets, however, most Americans dislike density. Many loathe it. For them, the “D” word means traffic congestion, crowded sidewalks, packed schools, long lines at the grocery store, and high crime rates. Without density, however, high-capacity transit tends to attract too few trips to offset the high price tag. As a result, there is a great interest in the minimum densities needed to support transit.
Without density, however, high-capacity transit tends to attract too few trips to offset the high price tag.
We review the literature on transit success and density, establish a methodology for evaluating cost-effectiveness, and relate this back to the numbers of jobs and residents around transit stations. Many recent transit investments have fallen short of the mark. Continuing to invest in high-capacity transit in low-density areas will require large subsidies per passenger trip and produce few tangible benefits. Instead, we recommend prioritizing investments in areas that meet, or have credible plans to meet, minimum density thresholds.
Transit and Population Density
In 1965, John Meyer, John Kain, and Martin Wohl wrote, “nothing is so conducive to the relative economy of rail transit as high volumes and population density. High population density increases the costs of all urban transportation, but substantially less for rail than for other modes.” They and other scholars found that rail transit, with its high up-front investment and high capacity, costs less than buses or cars only in corridors with high travel demand. Thus they found that rail was more cost-effective than buses or cars in high-density cities, while cars were more cost effective in low-density cities. The majority of job and population growth, however, was occurring in newer, low-density cities and in distant suburbs.
![]() A decade later, Boris Pushkarev and Jeffrey Zupan estimated minimum density thresholds for different types of public transit. According to their calculations, net residential densities of 12 households per acre surrounding a 50-million square-foot central business district (CBD)—roughly the size of Los Angeles’ or Newark’s downtown in 1970—could support a cost-effective heavy-rail investment. Nine households per acre surrounding a 20-to-50 million square-foot CBD could, at that time, support a minimal light-rail investment. By their calculations, Los Angeles, Seattle, and Honolulu could support heavy-rail transit, while Houston, Detroit, Dallas, Baltimore, and Miami were candidates for more limited, primarily above-grade, investments. Along with coauthor Robert Cumella, Pushkarev and Zupan later recommended light rail, with varying degrees of length and grade separation, for 16 mid-sized cities including Buffalo, Dallas, and Portland. Most of these cities have since built some form of light rail. The authors did not evaluate Sacramento or San Jose, and they recommended a no-build alternative for Phoenix; today all three cities operate light rail.
A decade later, Boris Pushkarev and Jeffrey Zupan estimated minimum density thresholds for different types of public transit. According to their calculations, net residential densities of 12 households per acre surrounding a 50-million square-foot central business district (CBD)—roughly the size of Los Angeles’ or Newark’s downtown in 1970—could support a cost-effective heavy-rail investment. Nine households per acre surrounding a 20-to-50 million square-foot CBD could, at that time, support a minimal light-rail investment. By their calculations, Los Angeles, Seattle, and Honolulu could support heavy-rail transit, while Houston, Detroit, Dallas, Baltimore, and Miami were candidates for more limited, primarily above-grade, investments. Along with coauthor Robert Cumella, Pushkarev and Zupan later recommended light rail, with varying degrees of length and grade separation, for 16 mid-sized cities including Buffalo, Dallas, and Portland. Most of these cities have since built some form of light rail. The authors did not evaluate Sacramento or San Jose, and they recommended a no-build alternative for Phoenix; today all three cities operate light rail.
What levels of density are needed to support rail investments?
Hindsight has not been 20/20. Pushkarev, Zupan, and Cumella’s recommendations are no less controversial today than they were three decades ago. Nevertheless, we can analyze and compare recent investments and investigate the factors—including density—that influence costs and passenger volumes. What levels of density are needed to support rail investments? While critics and advocates will continue to disagree on the merits of individual projects and transit in general, they can probably agree that, given a fixed pot of transit funding, cities should spend it on the projects that provide the highest benefits.
The Investments
We looked at 54 light-rail and heavy-rail investments from 1970 to 2006 in 20 US cities. Together they cost $66 billion in 2008 dollars and include 652 transit stations and 691 route-miles. To include data on fare revenues, operating costs, and passenger trips over time, we matched the investment data to annual system-level transit data. We also considered annual estimates of the number of jobs and residents around transit stations and other factors that influence transit ridership, such as fuel prices and economic growth.
Findings
![]()
Wide Variation
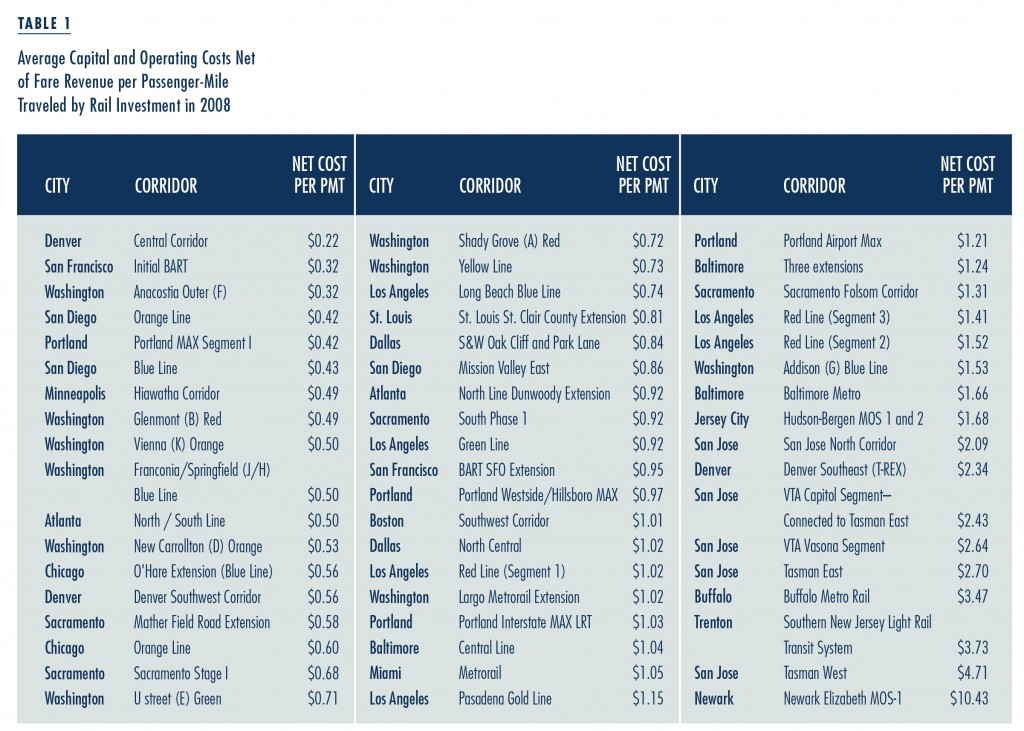
Recent transit investments have required large subsidies to cover operating losses and debt financing for capital costs. The net annual cost—operating costs and annualized capital costs minus fare revenues—is an approximation of the total financial subsidy across federal, state, and local agencies each year. The actual annual subsidy depends on other sources of revenue (such as advertising and lease payments) as well as loan terms and other capital finance mechanisms (such as tax-increment financing). In 2008, the median net cost, or subsidy, was $0.93 per passenger-mile, while the average net cost was $1.35 per passenger-mile. The standard deviation of $1.55 was higher than the average.
Several particularly expensive investments drive up the average. Table 1 lists the net annual costs per passenger-mile traveled (PMT) of each of the rail investments. Just over 80 percent had net costs of less than $2.00 per passenger-mile and approximately 20 percent had net costs of less than $0.50. The 2006 Newark light-rail extension from Penn Station to Broad Street required a staggering estimated subsidy of $10.43 per passenger-mile. The best-performing project, the Denver Central Corridor, cost $0.22 per passenger-mile after netting out fare revenues. Of the ten best performing investments, half are light rail and half are heavy rail.
The Cost-per-Mile Metric
More than capital costs, the number of passengers determines which systems are cost-effective. While researchers and journalists often compare rail investments by looking at how much they cost to build per route-mile, the benefits of low capital costs are often offset by even lower ridership. Of the 54 projects we examined, the heavy rail systems cost more than four times per route-mile to build as the light-rail systems, but due to higher patronage, were less expensive per passenger-mile. For example, the first section of the Red Line in Los Angeles cost more to build per route-mile than any other investment but had below average costs per passenger-mile. Because of its low ridership, San Jose light rail had among the highest costs per passenger-mile despite low investment costs per route-mile.
As a metric for comparing transit costs, cost per route-mile is somewhat misleading because the most expensive investments often have many more riders than less expensive ones. That said, the most cost-effective projects in our study had below-average capital costs per route-mile. Even if some of the least capital intensive projects are among the most expensive per passenger-mile, reducing upfront investment costs is an important component of increasing the cost-effectiveness of individual projects.
Unmet Thresholds
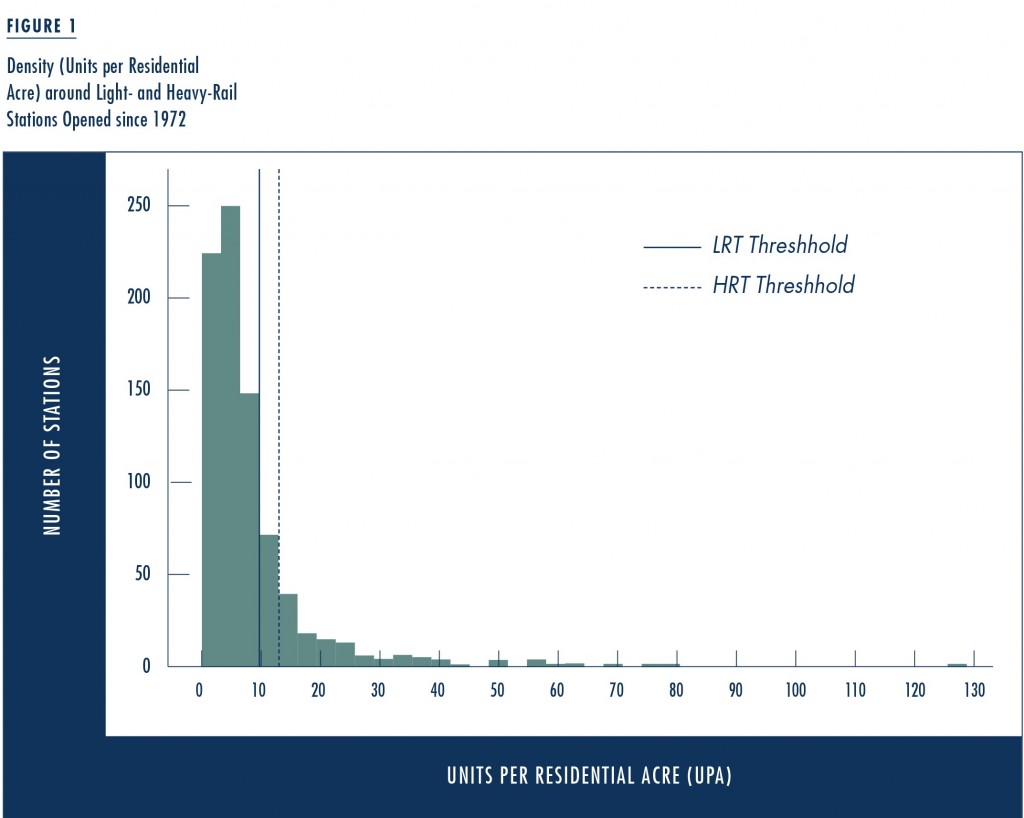
Despite an emphasis on escalating costs in transit literature, to our surprise we did not find a clear relationship between the age of an investment and its cost-effectiveness. Despite wide variation, Pushkarev and Zupan’s inflation-adjusted estimates of average rail transit capital costs were largely accurate. We did, however, find that the neighborhoods around new rail stations generally did not meet Pushkarev and Zupan’s minimum population density thresholds. The average rail investment of the past four decades has fewer surrounding households per acre than the authors’ recommended minimum. Just 26 percent of heavy-rail station areas and 19 percent of light-rail station areas surpass the minimum recommended thresholds. Figure 1 plots the average gross residential density, in 2000, of 526 light-rail and 261 heavy-rail stations that have opened since 1972 against the thresholds. More than high costs, this absence of density has hindered transit performance due to a shortage of origins and destinations around transit stations.
Updated Cost Effectiveness Thresholds
Using our recent investment and system data, we calculated minimum land use density thresholds for otherwise-average transit systems to be highly cost-effective. We defined cost-effective investments as investments that increased passenger-miles for a smaller estimated subsidy than either fare reductions or increased train frequencies on existing systems. Fare reductions, less expensive than increased frequencies, required an estimated $0.58 subsidy for each new passenger-mile. Roughly a quarter of the investments met this cutoff (Table 1). They carried 57 percent of passenger-miles on the 54 investments in 2008. Table 2 presents the minimum population density threshold to achieve high cost-effectiveness in an average light-rail and heavy-rail city with 100,000 and 350,000 jobs within a half mile of transit stations in the system. These thresholds assume that all other inputs, such as average fares, transit frequency, number of jobs within a half mile of stations, and track length, remain constant and average. At an investment cost of $25 million per route-mile, an average light-rail system in an average city will tend to be cost-effective with at least 14 people per gross acre living within a half mile of stations.
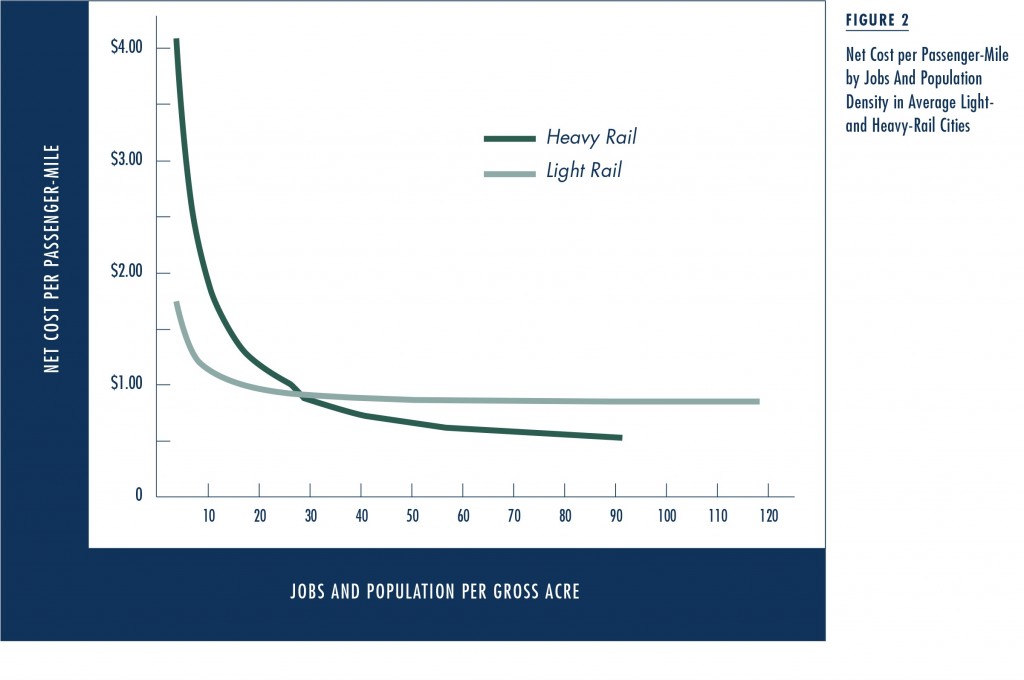
It is more expensive to build rail transit in dense areas, because of higher land-acquisition, labor, and relocation costs. Accordingly, we modeled cost per passenger-mile while allowing capital costs, as well as operating costs and passenger-miles, to vary with changes in job and population density. The results, graphed in Figure 2, suggest that, on average, light rail is more cost-effective than heavy rail in areas of up to approximately 28 residents and jobs per gross acre. With system-area densities near or below 20 residents and jobs per acre, Atlanta, Miami, and Baltimore appear better suited for light than heavy rail, while heavy rail is the appropriate choice in the San Francisco Bay Area and Washington, DC.
Costs and Jobs Matter
Transit-supportive density thresholds need to be viewed with caution. There is no one hard and fast rule that can be applied across all projects. Regression-based models mask considerable variation. For example, despite low surrounding densities, the Franconia-Springfield extension of the Blue Line in Washington, DC, is one of the best performing investments. Low capital costs, a plentiful supply of parking at stations, frequent train service, and good access to downtown jobs contribute to low costs per rider. By contrast, the Buffalo light-rail system is one of the least cost-effective, despite above-average job and population densities.
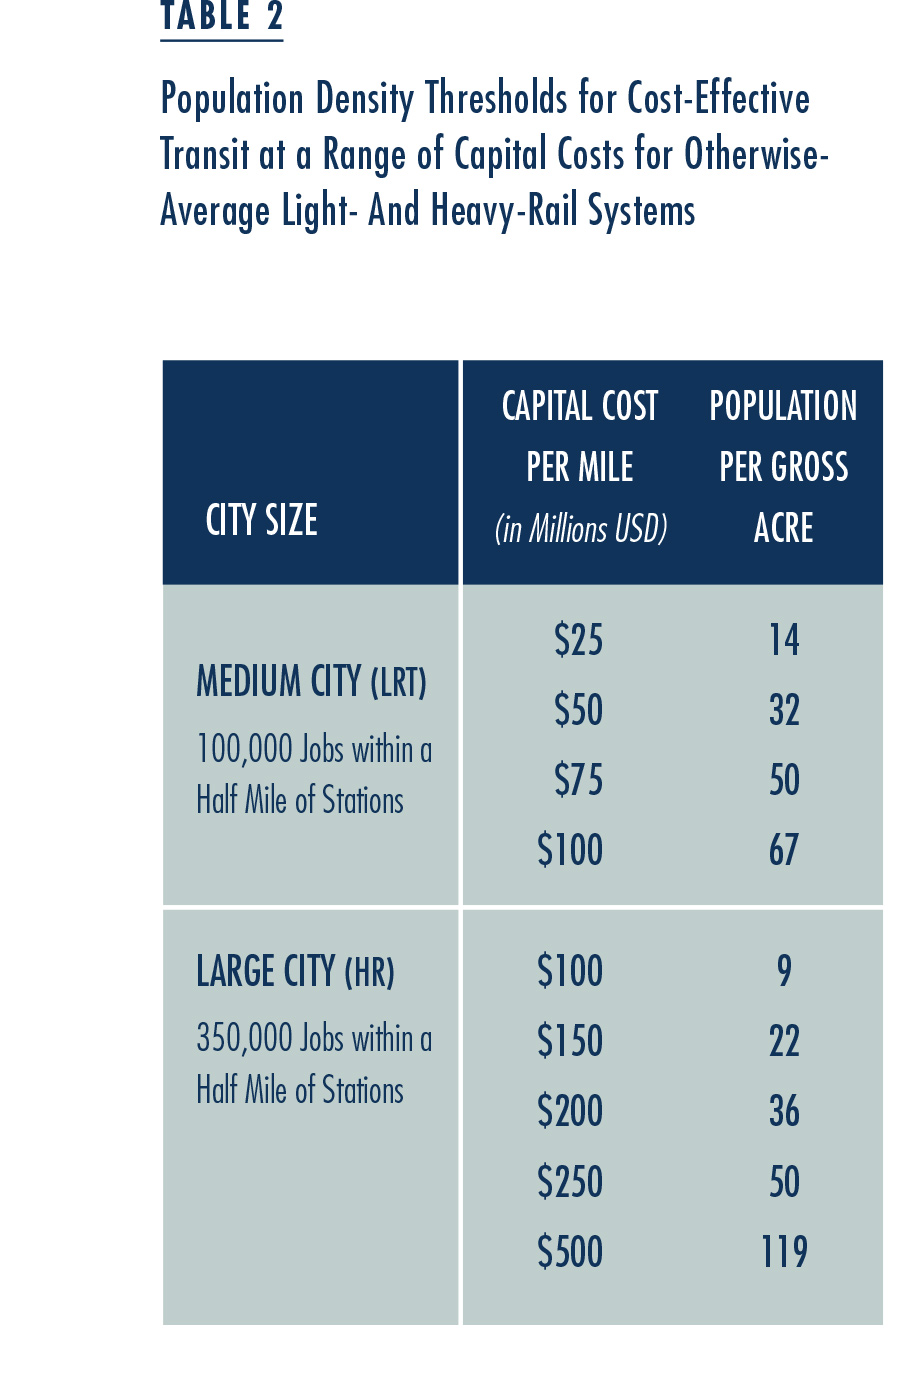 Furthermore, according to our model, average-cost, average-performance heavy-rail investments need surrounding densities of approximately 45 residents per gross acre within a half mile of stations to meet the cost-effectiveness threshold. Light rail needs about 30 residents per gross acre (Table 2). Only New York has higher average population densities around stations. Given political resistance to residential densification and market realities, city agencies cannot rely on residential density alone to promote cost-effective transit. They also need to increase the number of jobs around transit and to reduce capital and operating costs.
Given political resistance to residential densification and market realities, city agencies cannot rely on residential density alone to promote cost-effective transit.
In terms of density, increasing the number of jobs around stations appears to have a stronger impact on ridership than increasing the number of residents. Since jobs tend to be concentrated around existing downtown stations, however, few system expansions are likely to capture significant job concentrations. This means that rail expansions in residential areas need to be coordinated with proactive policies to facilitate job growth in other areas.
Mass Transit Needs Mass
At a time when fiscal resources are shrinking, rail transit has become a lightning rod for political controversy and infighting. Critics consider rail proposals to be among the most flagrant forms of pork-barrel politics today. Advocates counter that aggressively expanding the nation’s rail transit systems will, over the long run, yield many underappreciated environmental and societal benefits, including reduced carbon emissions and reduced dependence on foreign oil. Yet if rail transit is to yield appreciable dividends, there must be a closer correspondence between transit investments and urban development patterns. Many recent investments have failed in this regard.
Despite the unease many citizens, planners and politicians have with density, if costly rail and BRT investments are to pay off, larger shares of growth—particularly jobs—must be concentrated around transit stops.
All too often, rail transit investments in the US have been followed by highway-oriented, rather than transit-oriented, growth. Many systems lack the job or population concentrations that support cost-effective transit service. Despite the unease many citizens, planners and politicians have with density, if costly rail and BRT investments are to pay off, larger shares of growth—particularly jobs—must be concentrated around transit stops. In addition to local land use policies, this will require a significant reorientation of transit funding priorities in favor of investments in areas that meet, or have credible plans to meet, minimum density thresholds.
Further Readings
Erick Guerra and Robert Cervero. 2011. “Cost of a Ride: The Effects of Densities on Fixed-Guideway Transit Ridership and Costs,” Journal of the American Planning Association, 77 (3): 267–290.
John Meyer, John Kain, and Martin Wohl. 1965. The Urban Transportation Problem, Cambridge: Harvard University Press.
Boris Pushkarev and Jeffrey Zupan. 1977. Public Transportation and Land Use Policy, Bloomington: Indiana University Press.
Boris Pushkarev, Jeffrey Zupan, and Robert Cumella. 1982. Urban Rail in America: An Exploration of Criteria for Fixed-Guideway Transit, Bloomington: Indiana University Press.
Sam Seskin, Robert Cervero, Jeffrey Zupan, and Jane Howard. 1996. Transit and Urban Form, Report 16, Vol. I and II, Washington, DC: Transit Cooperative Research Program.