[sharelines]Insurance redlining follows geography and embeds inequality into institutionalized practice.
One of the most controversial issues related to automobile insurance is the accusation of “redlining,” or charging higher premiums in low-income, minority neighborhoods. Insurance companies base premiums on accident rates, which are higher in some neighborhoods. However, why those neighborhoods experience higher risks may not be part of the equation.
Traffic volumes vary across the urban landscape. Some areas are exposed to disproportionately high levels of externally generated trips. These increase accident frequencies in those areas, exposing local residents to higher-than-average chances of involvement in a crash. Insurance companies compensate for the higher accident rate by charging residents higher insurance premiums.
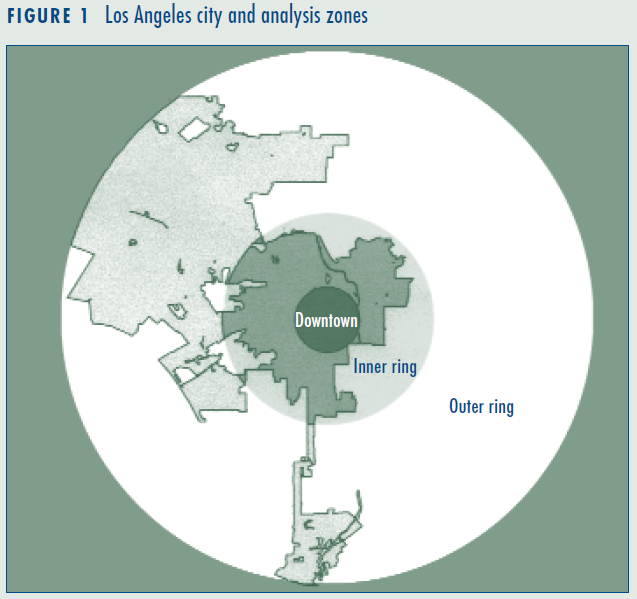
Figure 2 summarizes traffic-density statistics in three zones in Los Angeles. Citywide averages have a value of 1. The street network downtown is nearly twice as dense as the citywide average, while in the outer ring it is below average. Traffic volume is even more unequally distributed, with downtown having over twice the number of vehicle miles per square mile. Despite higher housing density downtown, the number of vehicles per household is lower than in the inner ring and local residents are less likely to commute longer distances. The outer ring has a lower vehicle density, reflecting the lower housing density. The average commute distance of inner-city residents is only three-quarters the distance of those in the outer ring. The data, then, show that higher traffic levels in downtown are not generated by local residents.
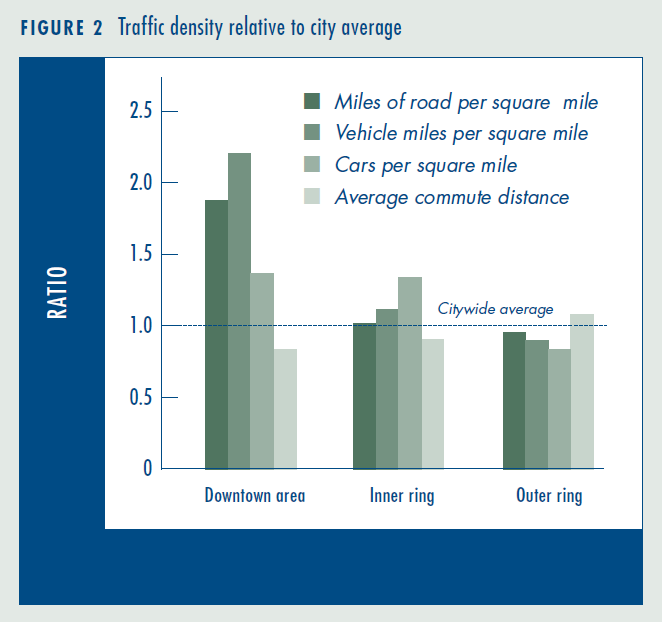
Figure 3 summarizes statistics on accident rates. The dark bars show that the accident rate per vehicle mile increases with traffic density. The odds of an accident occurring per vehicle mile in the downtown area is over one and a half times higher than in the outer ring. Traffic density is considerably higher in the down- town area; the number of accidents per square mile is over four times higher than in the outer ring. The geographic disparity in the number of accidents per vehicle by place of residence is nearly as large. The statistics do not mean that the number of accidents per neighborhood car is several times higher in the inner city than in the suburbs; accidents may involve local cars or cars from elsewhere. However, the risk of having an accident is higher in the downtown area, and local residents spend a disproportionate amount of their driving time on these streets, so the odds are stacked against them.
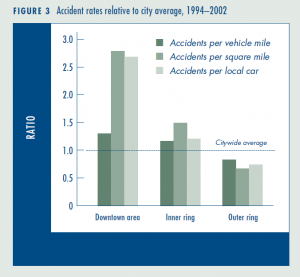
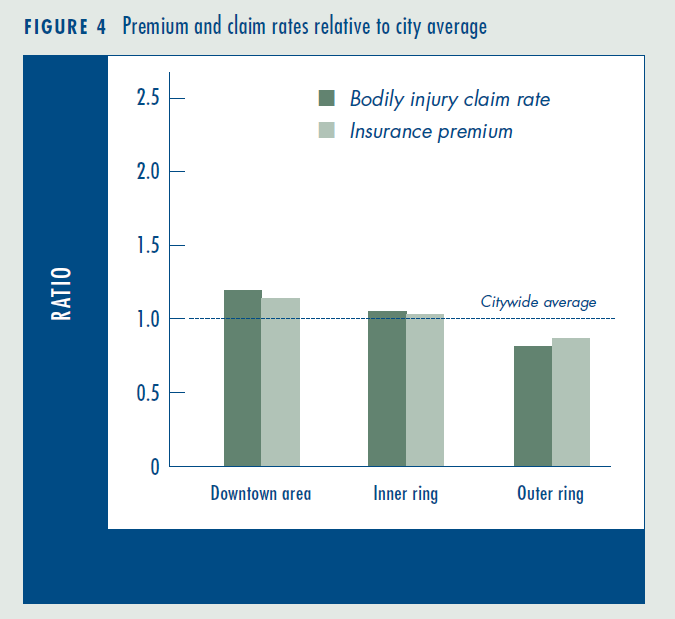
Figure 4 summarizes insurance claim rates and premiums as a percent of the citywide average. The bodily-injury claim rates are highest in the inner city and lowest in the outlying suburbs, reflecting the spatial pattern of accident rates. The higher claim rate in downtown is tied to a higher accident rate; in turn, higher insurance premiums are tied to the higher claim rate. This is consistent with the insurance industry’s assertion that premiums are based in part on an area’s accident rates. Figure 4 quotes insurance premiums for hypothetical individuals with the same coverage and the same driving record; differences reflect variation associated with location only. It may be economically rational for insurance companies to charge according to risk, but this practice imposes a financial burden on even good drivers in the inner city.
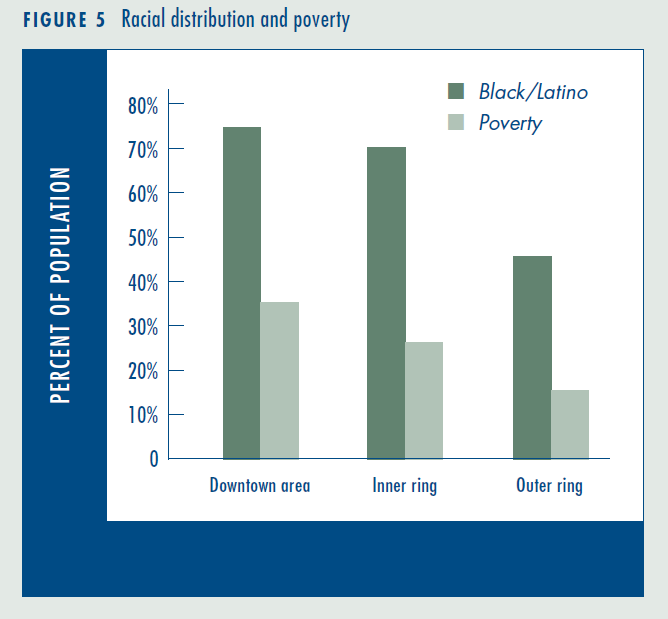
One of the societal consequences of the above findings is that disadvantaged people bear a disproportionate share of the economic burden generated by the region’s traffic. The disparities in premiums coincide with the socioeconomic geography of Los Angeles, summarized in Figure 5. Low-income, minority neighborhoods are heavily concentrated in the inner city around the downtown area. Insurance premiums are tied to actuary rates, but our analysis reveals that the high accident and claim rates in these neighborhoods are associated with externally generated traffic. These inequalities are embedded in the city’s spatial structure and in institutionalized practices.