In theory, public investments in mass transit can make urban economies more efficient by enhancing employers’ access to a larger labor pool at lower transport costs. Moreover, as first explained by Alfred Marshall, the concentration of economic activities in urban areas yields efficiency gains due to agglomeration economies. That is, each firm produces advantages that are shared by all firms located in the same area. The concentration of many businesses can thus produce many such external benefits. Can public transportation increase agglomeration economies?
Over the past few decades, many studies have attempted to measure the effects of agglomeration economies on labor productivity and wages. Few studies, however, have employed rent data to infer the presence of agglomeration economies or to measure how much external benefits increase economic efficiency. Since both capital and labor are inputs in production, the return to capital should reflect the economic efficiency of an urban area just as wages do. Thus, money invested in an area with higher external economies should generate higher returns on capital.
Agglomeration Economies
Office-based activities such as finance, law, accounting, advertising, information technology, and media employ much of the workforce in most large cities. The major capital input in such activities is office space. We use office rents to measure external economies and agglomeration benefits because these rents reflect the return to a key capital input in urban production, commercial office space. Simply put, areas with high concentrations of economic activity and external economies should have higher rents.
![]()
If public transit makes urban areas more efficient by promoting the economic benefits of agglomeration—through reductions in transportation costs and increases in mobility—all else being equal, these benefits should be evident in higher urban rents for office space. Our hypothesis was that office rents, as indicators of efficiency gains from the presence of urban agglomeration economies, will be higher in areas better served by mass transit.
Good mass transit enables large numbers of skilled workers to live in or travel to a small area. Such concentrations of workers increase the likelihood of agglomeration economies of two types: labor pooling and knowledge spillovers.
If firms that use highly specialized labor (such as attorneys experienced in corporate bankruptcies) lose key employees, they are far more likely to find replacements quickly if they are located near other firms that employ such workers.
Labor pooling is the high concentration of workers with specific skills in an area. If firms that use highly specialized labor (such as attorneys experienced in corporate bankruptcies) lose key employees, they are far more likely to find replacements quickly if they are located near other firms that employ such workers. Good public transportation increases the distances specialized workers can travel and increases the area from which firms can draw these workers.
Knowledge spillovers refer to the informal sharing of information among those engaged in the same occupation, whether it be stonework or computer software. Good public transit should increase the ability of workers to connect with others in their fields, increasing the level of knowledge “in the air.” Greater concentrations of workers in similar fields make fruitful exchanges more likely. High public transit use makes such concentrations possible and should increase the likelihood of agglomeration economies.
The Data
We use real estate data from Torto Wheaton Research and public transit data from the National Transit Database (NTD), plus government sources for economic data. Our sample of 42 Metropolitan Statistical Areas (MSAs) contains 118 real estate markets with over one million square feet of office space, observed over 17 years, from 1991 to 2007. The variables for each market are annual average gross rents per square foot of commercial office space, the supply of space in millions of square feet, the vacancy rate, and the amount of occupied space. Because there are at least two real estate markets in each MSA, the traditional downtown market is designated as the central business district (CBD) and the other(s) as suburban. The NTD annual data are organized by MSA, and we use annual transit passengers per capita in an MSA as a measure of transit service.
 The 118 real estate markets in our sample encompass 85 percent of US commercial office space, with each market containing at least one million square feet of space. All markets are within the boundaries of the 42 MSAs and do not overlap.
Table 1 ranks the 42 MSAs by size in terms of square feet of office space. Thirteen of the 14 largest MSAs have rail transit systems, some extensive, some not. These 14 metro areas (all with more than 70 million square feet of space of office space) account for about three-fourths of the space in all 42 areas. Many of the metro areas with more than 70 million square feet have high concentrations of space in the CBD. Generally, cities that were large before the advent of the automobile (such as New York, Chicago, Boston, and San Francisco) have much higher concentrations of space in the CBD than post-automobile cities such as Los Angeles, Dallas, Miami, and Houston. The pre-automobile cities tend to have extensive rail transit systems and built environments that increase the cost of driving—particularly by raising the cost of parking. Thus the supply of public transit matters for the concentration of space in the CBD, but so does the price of its substitute: driving.
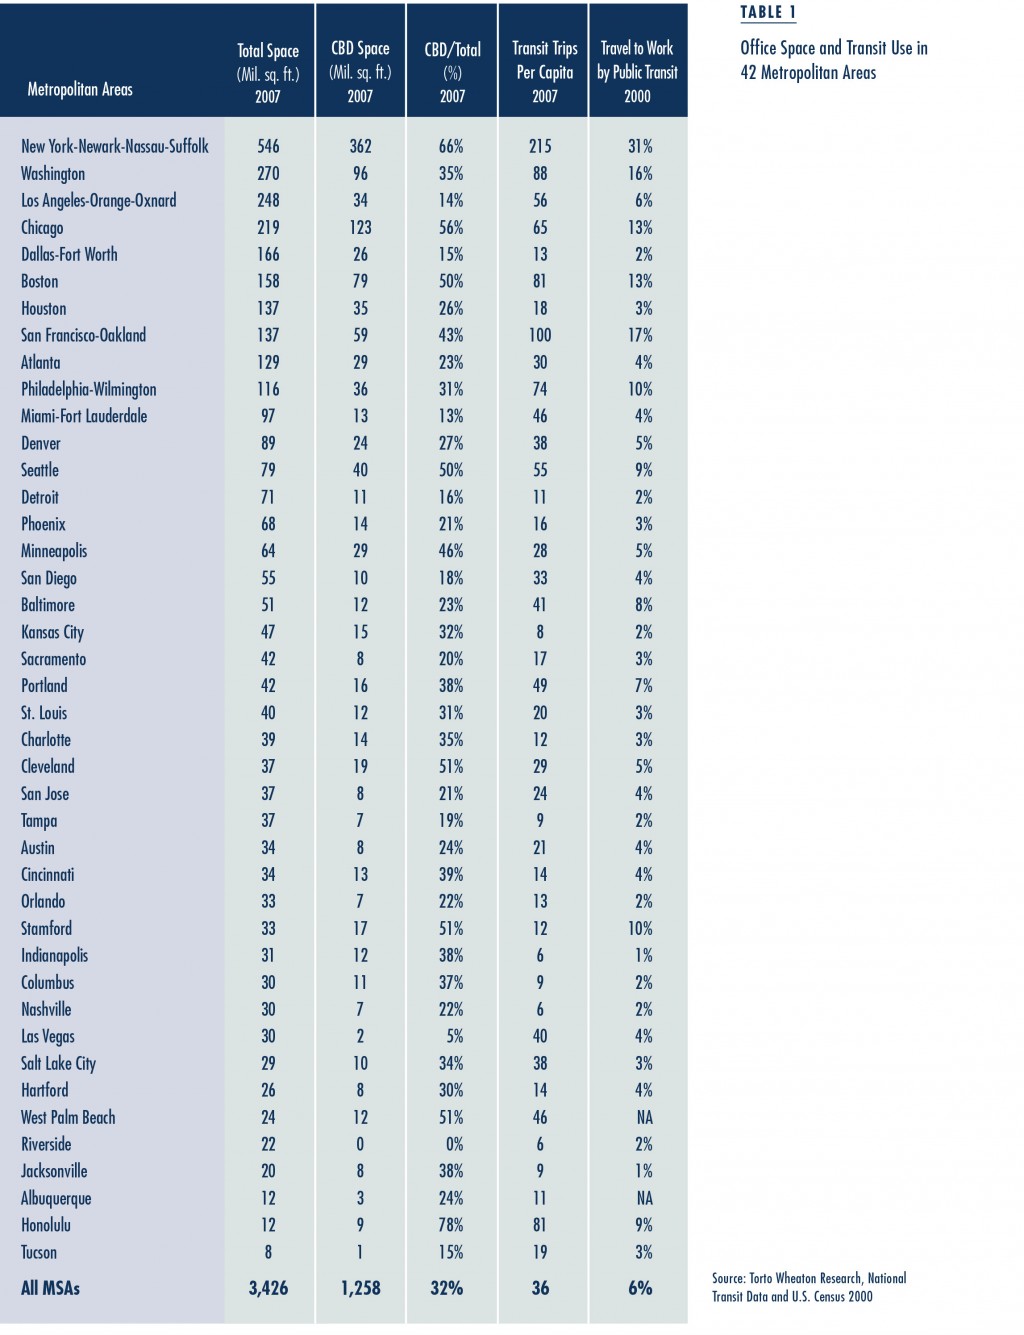
Is concentrated development, which is a precondition for the emergence of urban agglomeration economies, facilitated by public transit? It is hard to say, but the descriptive evidence of Table 1 suggests so. The three largest MSAs after New York, in terms of total office space, are similar in size: Washington (270 million square feet), Los Angeles (248 million) and Chicago (219 million). They are, however, dramatically different in terms of the absolute concentration of space in the CBD. Washington and Chicago have large CBDs and also have well-developed and utilized rail transit systems, while Los Angeles has neither. The fifth- and sixth-ranked cities, Dallas (166 million) and Boston (158 million), are almost equal in total size, but the Boston CBD has three times as much office space as the Dallas CBD. Again, Boston has a heavily utilized transit system while Dallas does not. Cities without extensive transit systems may have lower concentrations of office space in their CBDs because heavy commuting by private automobile places a de facto cap on how much office space can be accommodated in a region’s CBD. For example, in auto-dependent CBDs parking tends to crowd out office space and traffic congestion intensifies as CBDs grow. Another possibility is that a strong transit system, which generally has its hub in the CBD, makes a CBD location relatively more attractive than suburban locations.
 Table 1 also shows public transit use and the share of journeys to work by public transit. Per capita transit use (annual passenger trips divided by the metropolitan population) varies enormously among the 42 metropolitan areas, from 215 in New York to 6 in Indianapolis, Nashville, and Riverside. The share of journeys to work by mass transit exceeds 10 percent in only five places. New York is first at 31 percent, followed by San Francisco, Washington, Boston, and Chicago—all in the mid to low teens. Note that concentration of office space in these five cities’ CBDs ranges from 362 million square feet (New York) to 59 million (San Francisco), far exceeding that in any other metropolitan area. The data thus suggest a positive connection between the concentration of office space in CBDs and the use of public transit. We suspect that higher public transit use makes possible a much greater concentration of office space in the CBD.
Public Transportation and Agglomeration Economies
We use regression analysis to estimate the effects of public transit use on agglomeration economies, with office rents as the dependent variable. This method allows us to separate the effects of per capita public transit use from other variables (such as the office vacancy rate and the unemployment rate) on office rents. It addresses the question: Do CBDs with high concentrations of office space command higher rents because of higher public transit use?
For those CBDs with more than 30 percent of the total metropolitan office space, the effect of transit use on rents is small but positive and statistically significant
The tentative answer is yes—but not by a large amount. For those CBDs with more than 30 percent of the total metropolitan office space, the effect of transit use on rents is small but positive and statistically significant. For suburbs in those MSAs the effect is similar. By contrast, the results show that transit use has no effect on office rents in places with a low concentration of office space in the CBD.
These statistical results show that public transit appears to increase office rents, our measure of economic efficiency, but only for places with a high concentration (above 30 percent) of office space in the CBD. How big is the increase in rents and does it have any implications for expanding public transit? Our data show that a 10 percent rise in transit use raises office rents by only 0.5 percent. Using the mean office rent of $23.86 per square foot per year in 2007 for all markets, these percentage changes translate into rent gains of only 1¢ to 12¢ per square foot per year.
The policy implication is that rent gains from increasing transit ridership would be a tiny fraction of the cost of expanding public transit in MSAs with a high concentration of space in the CBD. Nonetheless, cities with high transit use and a strong concentration of office space in the CBD may protect existing office rent premiums from competing suburban locations by maintaining levels of service. The five high-transit-use cities (New York, San Francisco, Washington, Boston and Chicago) have much higher rents in the CBD than in the suburbs, and the CBD premium has not been shrinking. In 2007, the average CBD rent of these five cities was $42 per square foot per year compared with $26 for the suburbs. All 37 other MSAs had a premium for CBD office space in the early 1990s, but it disappeared around 1995. Since 2005, suburban rents have been about $1 per square foot per year higher than CBD rents.
Judging from the disappearance of a rent premium for the CBD in most cities, transportation and communication technology may have led to the relative “death of distance” in most metropolitan areas. Rent premiums in the CBD, however, appear to be alive and well in the five places with the highest number of transit journeys to work. Based on our argument that office rents manifest benefits of agglomeration, we infer that in some places public transit use modestly contributes to urban economic efficiency.
Our analysis did not show that expanding public transit would achieve large gains in economic efficiency.
What do these results indicate for public policy? Our analysis did not show that expanding public transit would achieve large gains in economic efficiency. Even in cities with a high concentration of office space in the CBD, we estimate that increasing transit ridership by 10 percent will increase office rents by no more than 0.5 percent. For all other cities, we estimate that increasing transit ridership will have no effect on office rents. On the other hand, public transportation has many benefits beyond increasing office rents. For example, it can increase access for people without cars, reduce traffic congestion, and improve air quality. It does not appear, however, that increasing transit ridership will significantly increase agglomeration economies.
Further Readings
Matthew Drennan and Charles Brecher. 2011. “Does Public Transit Use Enhance the Economic Efficiency of Urban Areas?” Journal of Transportation and Land Use, Forthcoming.