In an era of stretched tax revenues, shrinking public sector budgets, and partisan debates over the appropriate role and scale of government, investments in public transit systems have been increasing. While the Great Recession has recently squeezed many transit operating budgets, overall public capital and operating subsidies of transit systems have grown dramatically over the past decade. Why have transit expenditures grown when so many other facets of public expenditure have shrunk? Concerned with chronic traffic congestion, sprawl, and the environmental sustainability of car-centered transportation, officials at all levels of government have shifted urban transportation priorities from increasing road capacity to increasing transit capacity, especially in the biggest metropolitan areas. We have, in other words, bet heavily on public transit to help us solve pressing social and environmental problems.
Why have transit expenditures grown when so many other facets of public expenditure have shrunk?
So is our bet paying off? The good news is that national transit patronage in 2009 was up 36 percent over 1995, and up 9 percent over 2001. The rate of growth for transit ridership has outpaced metropolitan population, which has grown 16 percent since 1995 and 7.5 percent since 2001. But transit service has grown much faster than transit use. Since 2001, vehicle-hours of transit service rose by 23 percent, but transit passengers per vehicle-hour declined by 11 percent. Given these countervailing trends, it is no surprise that public transit subsidies—the tax dollars required to cover the gap between the cost of providing transit service and farebox revenues—increased by 66 percent between 1995 and 2009, after controlling for the effects of inflation. So while transit use is up, transit subsidies have risen far faster—meaning that the effectiveness of these subsidies is dropping at an alarming rate.
Why are increasing transit subsidies “buying” so few new riders? This simple question has a complicated answer. One important part of the answer has been the focus on investing in new high-capacity, trunk-line services in relatively few corridors, which often feature elaborate stops and stations intended to serve as magnets for development. Sleek new rail and rapid bus lines with attractive stops and stations are typically faster than local buses, and are thought to have a far better shot at luring drivers out of their cars.
In recent years, this attractive promise has prompted more than three dozen cities around the US—from Atlanta to Los Angeles to Washington, DC—to build new rail transit lines and expand existing ones. However, this rail development often comes at the expense of bus service, which is less glamorous but essential for the mobility of many, particularly the urban poor. Since 2001, inflation-adjusted rail transit capital and operating subsidies per urban resident rose 16 percent, while equivalent bus subsidies per resident actually fell 4 percent. This focus on increasing transit vehicle speeds between more attractive stops and stations is not exclusive to rail; the recent wave of busway and bus rapid transit investments has been driven by similar goals.
Hate to Wait
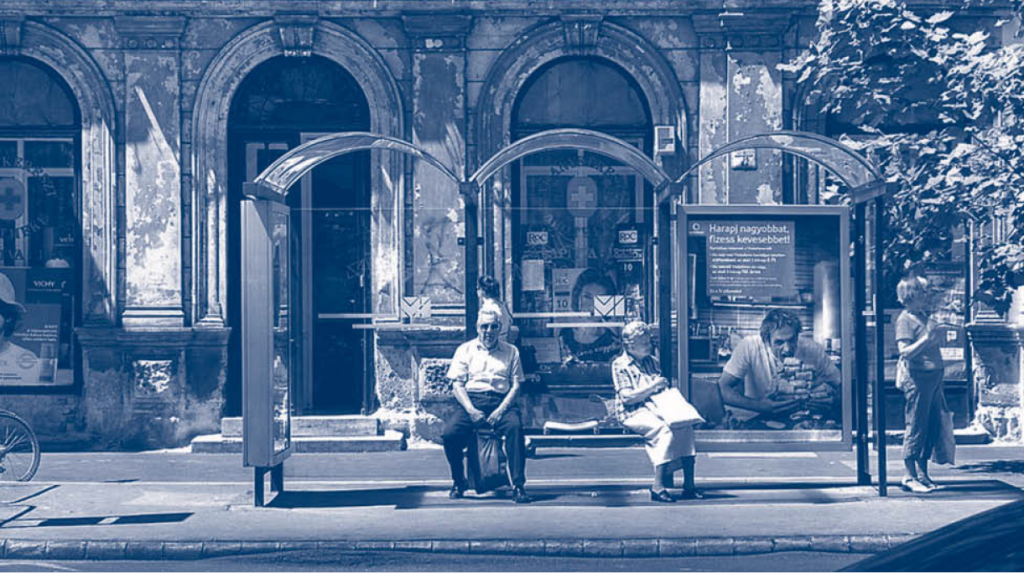
 But is spending a lot of money on new, faster trains and buses—along with capital-intensive stops and stations—the best way to increase transit ridership? Recent declines in public transit productivity and the research we discuss here suggest that it is not. Travel by public transit involves more than just riding in buses and trains. A typical door-to-door trip entails walking from one’s origin to a bus stop or train station, waiting for the vehicle to arrive, boarding the vehicle, traveling in the vehicle, exiting from the vehicle, and then walking to one’s final destination. In many cases, the trip involves transfers: travelers alight from one transit vehicle, move to a new stop or platform, wait for another transit vehicle, and board that vehicle. Research shows that the time and energy travelers spend walking and waiting outside of vehicles greatly influence their perceptions of transit travel. Indeed, research suggests that these out-of-vehicle experiences have considerably more influence on travelers’ perceptions of transit travel than the time spent in vehicles.
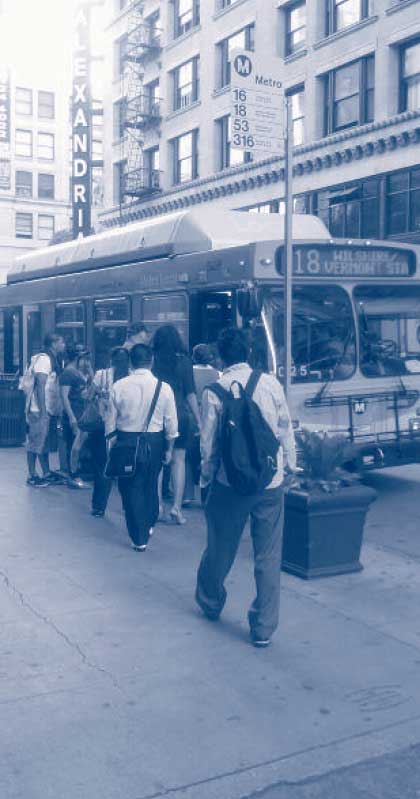
As cities have grown more dispersed and auto-oriented, the share of transit trip times spent outside of vehicles has increased. First, simply accessing transit stops and stations can be an ordeal when service coverage and frequency are sparse in far-flung suburbs. In addition, the focus on rail and bus rapid transit investments has created a need for local feeder services, thus increasing the likelihood of transfers between the local and express lines. As a result, transit travel in the US frequently entails transfers among lines, modes, and operators—approximately 40 percent of transit trips involve one or more transfers.
Over the years, many researchers have examined transit travelers’ perceptions of the burdens of walking, waiting, and transferring, both by asking travelers directly about their perceptions and by observing their behavior. These studies have found that, on average, transit travelers view time spent outside of vehicles as roughly three times as onerous as time spent in vehicles, though this value can vary dramatically. Researchers have found that the typical ratio of perceived out-of-vehicle burden to in-vehicle burden lies between 1.5 and 4.5, depending on the characteristics of the waiting experience. Trips where travelers fear for their safety, are waiting in inclement weather, experience unexpected delays, or must wait a very long time all increase the perceived burden of transit travel, often substantially.
Collectively, these studies suggest that reducing both actual wait times and the uncertainty of waiting may substantially lower the perceived burdens of using transit. Successful efforts to reduce perceived walk, wait, and transfer penalties can have a greater effect on travel behavior than even doubling vehicle speeds with a new rail or busway line, and can be done at a fraction of the cost.
Improving the Wait/Transfer Experience: What Do Travelers Think?
 Given this research on the importance of out-of-vehicle experiences to transit users, we asked: What are the best ways to reduce out-of-vehicle travel burdens and improve transit users’ experience at stops, stations, and transfer facilities? To address this question, we worked with local transit operators to select stops and stations that were as different from one another as possible—from elaborate multi-modal transit centers to bus stops signified by no more than a simple sign. In total, we selected 34 transit stops and stations in metropolitan areas around California. At these stops, we surveyed 2,247 transit users in the midst of waiting and transferring, at different times and in varying weather conditions, to get a clear and immediate sense of how they felt about their waiting experience. We developed a survey that asked about 16 different attributes reflecting stop and station access, connections and reliability, information, amenities, and safety and security. Attributes included station/stop cleanliness, the absence of graffiti, the availability of information, the provision of seating, etc., as listed in Figure 1.
We asked riders to rate (1) how important particular stop/station attributes were to them, (2) how satisfied they were with these attributes at that particular stop/station, and (3) their overall level of satisfaction with their transfer experience. We then analyzed how satisfied riders were with the attributes they found most important. Figure 1 summarizes the relationship between the relative importance transit users in our sample assigned to each attribute and their level of satisfaction with that attribute.
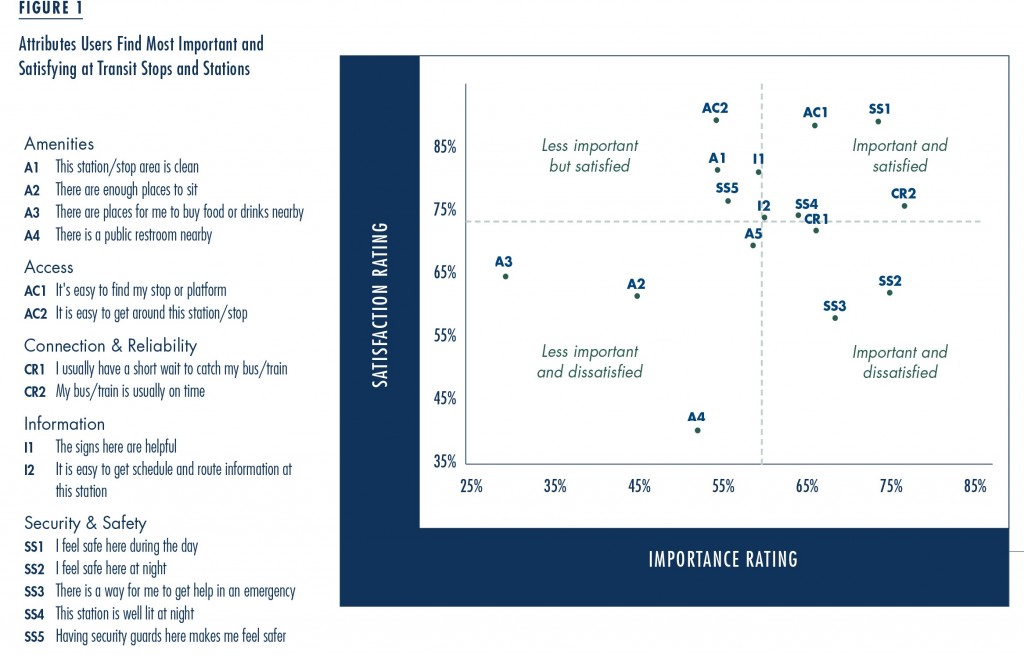
By combining the importance and satisfaction ratings and then plotting them relative to their averages (indicated by the dotted lines), we classify transfer facility attributes into four categories. First, the top-right quadrant depicts attributes (such as feeling safe during the day) that respondents rated as important and for which they also reported considerable satisfaction. Second, respondents rated the attributes in the bottom-right quadrant (such as feeling safe at night) as important but unsatisfactory. Third, attributes in the top-left quadrant (such as having enough places to sit) were viewed with considerable satisfaction by users, but were also rated as less important. Finally, the bottom-left quadrant displays attributes (such as having a public restroom nearby) that were rated as both less important and unsatisfactory across the diverse set of stops and stations we surveyed.
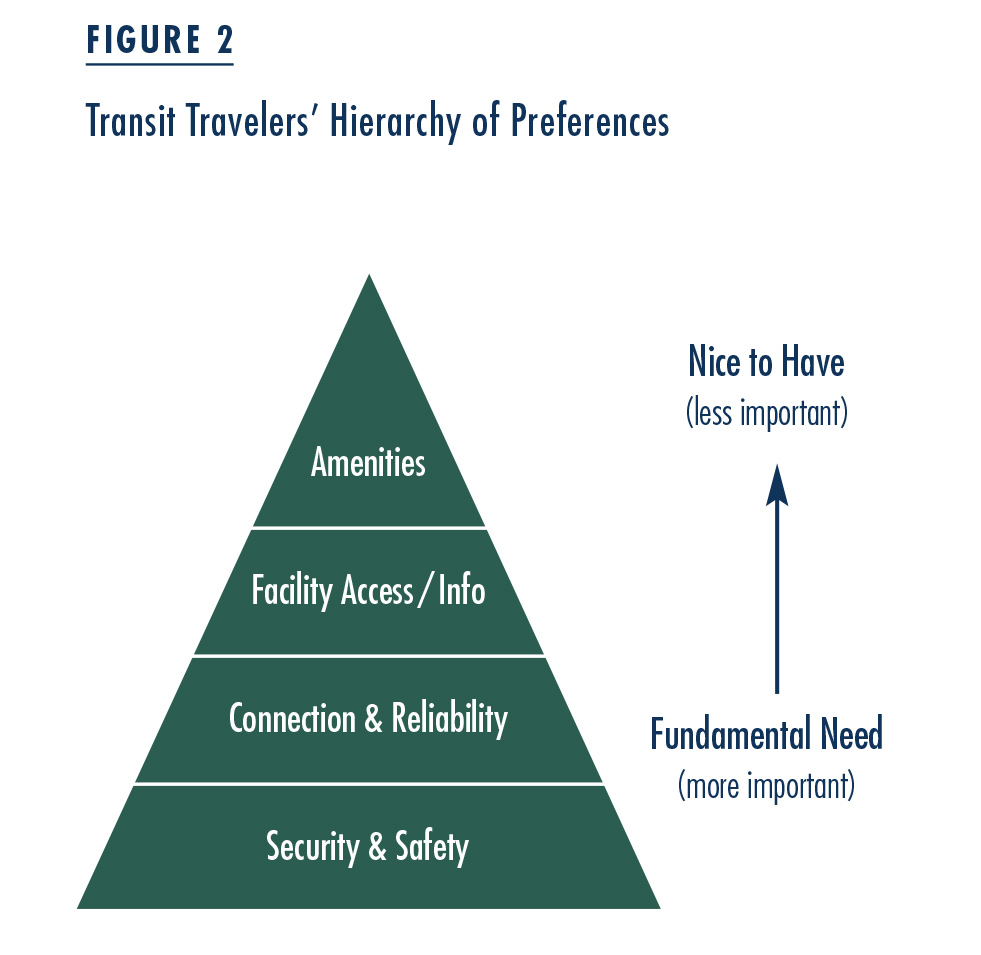
Improving on-time performance and safety and security measures (such as through the presence of security guards and lighting) are more likely to increase overall satisfaction than adding amenities like seating and shelters.
We also used ordered logistic regression models to examine which attributes of stations and stops best explained transit users’ overall satisfaction with their transit trips. Again, we found that transit riders tend to care more about personal safety and frequent, reliable service than the physical conditions of transit stops and stations. In other words, our findings suggest that most passengers will opt for safe (even if lackluster) stops and stations with frequent, reliable service over stops with infrequent service and abundant benches, shelters, and other amenities. Thus, improving on-time performance and safety and security measures (such as through the presence of security guards and lighting) are more likely to increase overall satisfaction than adding amenities like seating and shelters. One can think of these attributes in terms of a relative hierarchy of transit users’ preferences as shown in Figure 2.
 Finally, we analyzed how the duration of wait times affected the importance that travelers assigned to different attributes. In other words, how important are attributes such as benches and shelter as wait times increase? We found that transit riders valued safety and security, service reliability, and on-time performance regardless of whether the wait is expected to be short or long, but the importance of amenities—shelter, seating, restrooms, and nearby food and drinks—increased substantially with longer wait times. While such a finding may seem reasonable, even obvious, it does pose a dilemma for transit planners. Stop and station amenities can be expensive to provide, so transit managers quite naturally tend to put them at high-volume stops and stations where more people can enjoy them. But such high-volume stops and stations tend to have the lowest average wait times and thus are precisely the locations where such amenities are least valued by individual passengers.
What do these findings tell us about current trends in transit investments? We also surveyed transit managers—those responsible for planning and delivering transit services and facilities—to understand whether they perceived the importance of stop/station attributes in the same way as their riders. Nearly two hundred transit managers responded to our inquiry, and we found that managers, by and large, understand what their passengers value and find important. They know that safety and security are most important to a good stop/station, followed by frequent and reliable service. They also understand that comfort and aesthetic factors, though important, rank well below these other more fundamental attributes.
While managers appear to understand their riders, and therefore emphasize functional attributes, such as safety and security, pedestrian/vehicle conflicts, and schedule coordination, their responses to our survey suggest that they tend to focus on the physical attributes of transit systems in addressing these functional attributes. But focusing on facility design is potentially misleading, as frequent, reliable service is largely unrelated to the physical characteristics of a stop or station. Research has shown that riders worry more about their safety on the walking, waiting, and transferring portions of transit trips, than any other aspects of transit trips. Thus, riders’ overwhelming concern with safety suggests that a central determinant of satisfaction and thus transit use lies partially, and sometimes completely, outside the control of transit agencies, because local governments are typically responsible for the policing of most transit stops.
Getting More Bang Out of Our Transit Buck
 Given the importance of walking, waiting, and transferring to the transit travel experience, what does our study suggest for transit managers interested in attracting more riders and improving the effectiveness of transit investments?
First, transit planners and managers should satisfy the most basic building blocks of user preferences before investing in improvements that are less important to riders. Planners and managers should aim to reduce the most burdensome perceived obstacles to transit use by ensuring a safe and secure waiting environment for passengers. Only after this most fundamental need has been met to the degree possible should operational enhancements be made to improve service frequency and reliability. After these needs have been met, improvements to stop/station accessibility are next in line. Finally, only after all of these needs have been addressed can transit managers then justify devoting resources to improving stop and station amenities.
But what’s a transit operator to do when faced with limited operating funds that preclude the addition of more frequent service? While our study clearly shows that service frequency and reliability are most critical to rider satisfaction, other cost-effective measures—such as “next vehicle” arrival-time indicators that reduce rider uncertainty—can go a long way toward reducing the perceived burdens of transfers and waiting. Such improvements can be much more cost-effective than building high-capacity, trunk-line services.
Consider the hypothetical example of a four-mile bus trip involving a 10-minute wait prior to a 20-minute ride to the final destination (Table 1, Row A). If the traveler has no information about the likely arrival time of the next bus, research tells us that this uncertainty will add significantly to his or her perceived trip time. One way to make the existing service more attractive would be to install accurate real-time information on the expected arrival time of the next two buses for each line operating at a given stop, and to make this information easily available at the stop and on mobile phones. The actual wait and in-vehicle times don’t change, but travelers’ information about their expected wait time improves dramatically (Row B). If the cost of the next-bus system is $1 million per mile, the total cost for the four-mile segment is $4 million, and travelers perceive a 15-minute time saving for the trip.
If the traveler has no information about the likely arrival time of the next bus, research tells us that this uncertainty will add significantly to his or her perceived trip time.
Another way to make this trip more attractive is to add a new, faster light-rail service operating on a parallel right-of-way (Row C). Free of most delays from operating in mixed traffic, the new service doubles travel speeds, cutting the in-vehicle travel time in half. As before, travelers on this hypothetical new service are given no accurate real-time information on the expected arrival time of their train. If the cost of the light-rail system is $100 million per mile, the total cost of the four-mile segment is $400 million, and travelers experience and perceive a 10-minute time saving for the trip.
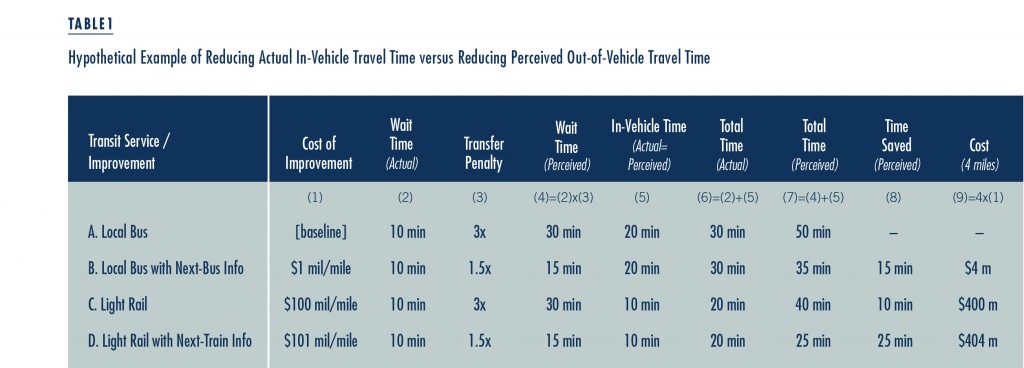
In this example, spending $4 million to provide a next-bus information system would reduce perceived travel time by 15 minutes (Row B), while spending $400 million to build a light-rail system (Row C) would reduce perceived (and actual) travel time by only 10 minutes. The next-bus system would cost only 1 percent of the light-rail system, but deliver 50 percent more perceived time savings. This hypothetical example shows how improving bus service can be far more cost effective than even doubling vehicle speeds with a new rail line.
All else equal, the purpose of transit is to convey users to destinations, not simply to make them equally happy at stops and stations. Thus our findings suggest that transit managers, when they have a choice, would be well-advised to favor service frequency/reliability improvements over stop or station improvements. While lower in-vehicle travel times and comfortable, informative, and attractive stops and stations can make traveling by public transit more agreeable, what surveyed passengers report that they really want most is safe, frequent, and reliable service, plain and simple.
Further Readings
Hiroyuki Iseki and Michael Smart. Forthcoming. “How Do People Perceive Service Attributes at Transit Facilities? An Examination of Perceptions of Transit Service by Transit User Demographics and Trip Characteristics,” Transportation Research Record: The Journal of the Transportation Research Board.