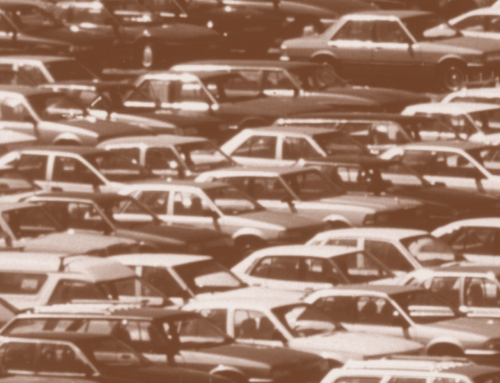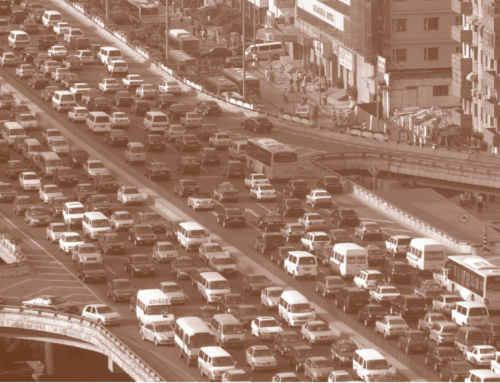
 Sprawl has no single definition. Many people, however, tend to think of “sprawling” cities as places where people make most of their trips by car, and non-sprawling cities as places where people are more likely to walk, cycle, or take transit. This is why Los Angeles, which has more vehicles per square mile than any other urbanized area, and where transit accounts for only two percent of the region’s overall trips, is considered sprawling, while the New York urbanized area is not. We also know (or think we know) that places where people frequently walk, cycle, or take transit tend to have high population densities, and for this reason we tend to view low density as a proxy for sprawl. But as it turns out, the Los Angeles urbanized area—which in both myth and fact is very car-oriented—is also very dense. In fact, Los Angeles has been the densest urbanized area in the United States since the 1980s, denser even than New York and San Francisco.
These facts present a bit of a mystery. If one were to measure sprawl by measuring a region’s average level of Vehicle Miles Traveled (VMT), Los Angeles would certainly qualify as sprawling. But if we measure sprawl by population density, LA would not sprawl at all. In fact, it would be the least sprawling urbanized area in the country. How can Los Angeles be so dense and yet also exhibit so many characteristics associated with sprawl, including high levels of car travel (both in per capita and absolute terms) and low rates of walking, bicycling and transit ridership?
Part of the answer lies in the vagaries of Census geography. Sprawl is a regional attribute, so when observers point out that LA is denser than New York, they are not talking about the cities of Los Angeles and New York. Rather they are talking about the urbanized area, which is essentially the combined area of the cities and their suburbs. The other part of the answer is that density by itself—the simple ratio of population to square mile—is not a very useful way to measure sprawl. What matters is the distribution of density, or how evenly or unevenly an area’s population is spread out across its geographic area. If we look at the density distribution in Los Angeles, we notice that its suburbs are much denser than those of other large U.S. cities, such as New York, San Francisco or Chicago. These high-density suburbs compensate for the comparatively low density of LA’s urban core, and, in so doing, increase the average density of the area as a whole. In other words, Los Angeles has both a relatively high density and a relatively even distribution of density throughout its urbanized area.
The LA region’s combination of high, evenly distributed density puts it in an unfortunate position: it suffers from many of the problems that accompany high population density, including extreme traffic congestion and poor air quality; but lacks many of the benefits that typically accompany more traditional versions of dense urban areas, including fast and effective public transit and a core with vibrant street life. Los Angeles has, to borrow a term coined by urbanist William Fulton, “dense sprawl.” (Or, to be less charitable, it has “dysfunctional density.”) It is too dense to function like classic suburbia, but also has few areas dense enough to be a “city” in the manner of central city New York or San Francisco.
Los Angeles has “dense sprawl.” Or, to be less charitable, it has “dysfunctional density.”
Why does this matter? The point is not to pick on Los Angeles, which has many wonderful attributes to go along with its problems. Rather Los Angeles highlights a weakness in the way we traditionally think about density and sprawl. Planners are often quick to recommend increased density to combat congestion and make cities more livable, but LA shows us that simply chasing density, without thought as to where that density is, will not do much to help and might actually make things worse. In the remainder of this article I will examine LA’s population distribution in more detail and then discuss how traditional measures of density can mislead planners and transportation policymakers. Finally, I examine three alternative ways to measure density that may be more useful.
Density Without Downtown, Sprawl Without Suburbia
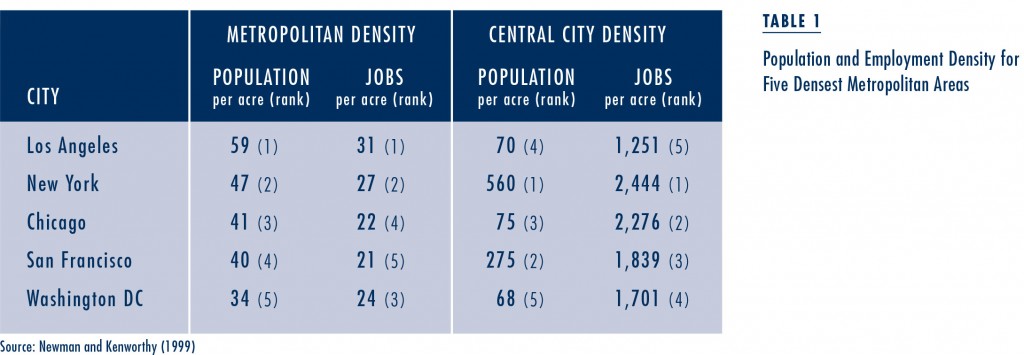
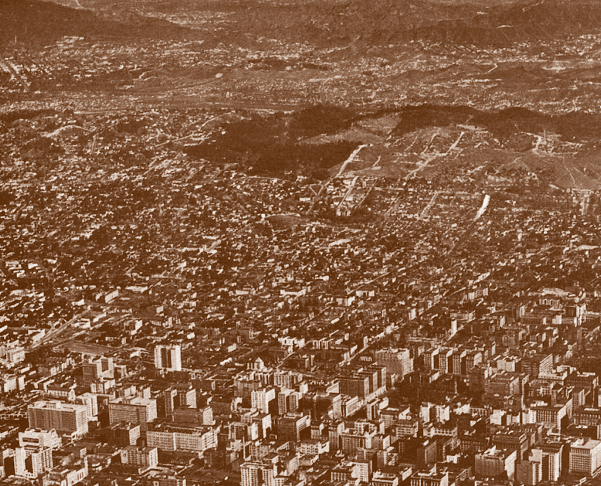
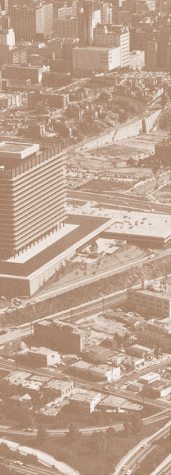
People are often surprised to learn that Los Angeles is dense. Some of this surprise probably stems from a tendency to associate urban density with busy downtown centers. Many people, when they think about urban density, understandably picture Manhattan or Hong Kong, not LA. And it’s true that Los Angeles doesn’t have much of a center; it is one of the most decentralized urban areas on earth. But of the five densest metropolitan areas in the U.S., LA is the densest, both in people and jobs. At the same time, however, its central city has the lowest job density of these five areas, and the second lowest population density (see Table 1). Only six percent of the region’s jobs are in the central business district, and only twelve percent are located in the region’s nineteen largest job centers. Downtown Los Angeles is even less significant as a residential area: despite a surge in loft construction over the past decade, its daytime population of approximately 500,000 people is over twelve times larger than its residential population of 40,000. The population of Manhattan, by contrast, only doubles during the day.
Of the five densest metropolitan areas in the U.S., LA is the densest, both in people and jobs.
So it is clear that Los Angeles lacks a super-dense core like Manhattan. But it also lacks a very low-density suburban periphery. Suburban neighborhoods in the Los Angeles region are much denser than their counterparts in the Northeast and Midwest. Indeed, one might say that they are not classically suburban, in the sense that few of them offer large houses on large plots of land, uncongested roads, and easy access to open space.
But while the suburbs of metropolitan Los Angeles are dense compared to the suburbs of other U.S. urban areas, most (with some notable exceptions) are not dense enough to support traditional urban amenities like frequent and high quality public transit and bustling commercial districts with sidewalk cafes and pedestrian-oriented retail. Like the distribution of population in metropolitan Los Angeles as a whole, the distribution of density throughout most of these outlying areas is not clustered at nodes or along densely populated corridors that can be easily served by public transit. It is spread evenly throughout these areas.
Why Measures of Average Density Fall Short
Why do standard measures of density mislead? Two reasons: first, the standard measure relies too much on where the urbanized area’s formal boundary is drawn, and second, the measure is determined by total land area, even if some of the land is sparsely populated.
Compare New York and Los Angeles again. By the standard measure, Los Angeles, with 59 people per acre, is considerably denser than New York, with 47. A big part of the reason is LA’s dense suburbs, but this explanation is somehow unsatisfying. I suspect that for many people, the fact that Palmdale (a suburb of LA) is denser than White Plains (a suburb of New York) shouldn’t lead to the conclusion that Los Angeles is denser than New York. But if we measure density simply by dividing land area into population, that is exactly the conclusion we get.
So is there a better way to measure density? Below I discuss three alternative approaches that might be more helpful in understanding the development patterns of dispersed and polycentric urban regions like LA. One method measures unequal density in the distribution of population; the other two attempt to measure density as it is experienced by the average resident of a given urban area.
Measuring Variation in the Distribution of Population
The Gini Coefficient
One approach is to measure the extent to which the population density varies across an urban area. Using a statistical tool called the Gini coefficient, we can get a sense of the degree of variation for different urban areas. The Gini coefficient is based on the Lorenz curve, a cumulative frequency curve that compares the distribution of a specific variable (in this case, population density) with a uniform distribution that represents perfect equality.
Figure 1 shows the distribution of population for three urbanized areas (Los Angeles, New York, and San Francisco) by Census tract, relative to the proportion of land. The diagonal line represents a perfectly equal distribution, or a Gini coefficient of 0. The more the curve strays from the diagonal line, the greater the variation in population density. Perfect inequality—if all the residents of a city inhabited one single census tract—would be represented by a value of 1.
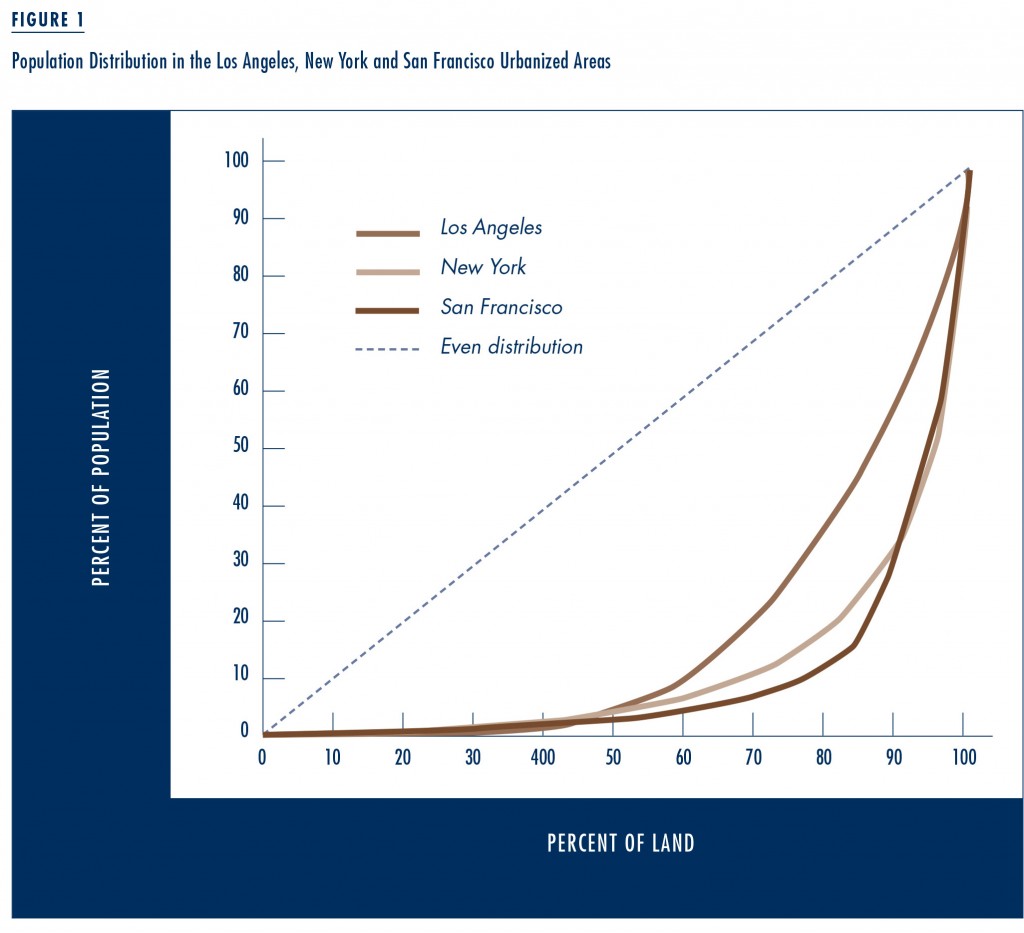
Measuring inequality in this way, the Gini coefficient is 0.65 for Los Angeles, 0.77 for New York, and 0.80 for San Francisco. In graphical terms, the Los Angeles curve stays closer to the diagonal line—the line representing an even distribution—than the curves for New York or San Francisco. This might help explain why Los Angeles appears to be less dense (and therefore also less “urban” in the classical sense discussed earlier) than San Francisco and New York, even though its average population density is higher. The population of all three urbanized areas is distributed unevenly. However, this distribution is much more even in Los Angeles than it is in New York and San Francisco.
The difference between Los Angeles and the other two regions becomes even more pronounced when one looks only at the most densely populated census tracts in each urbanized area. In Los Angeles, 40 percent of the population live on the most densely settled 10 percent of land. By way of comparison, roughly 66 percent of New York’s population, and 67 percent of San Francisco’s, live on the most densely settled ten percent of the land. By looking even further to the right of the graph, one finds that 25 percent of the population in Los Angeles lives on the densest 5 percent of the land. By contrast, 46 percent of San Francisco’s population, and more than 50 percent of New York’s, live on the densest 5 percent of the land. The overwhelming majority of New York and San Francisco’s residents live on a very small portion of their urbanized areas’ land. But this is much less the case in LA.
The overwhelming majority of New York and San Francisco’s residents live on a very small portion of their urbanized areas’ land.
Perceived Density
Another approach to measuring density, which was developed separately by both Gary Barnes and Chris Bradford, is to use “perceived” or “weighted” density. The purpose of perceived density is to capture the density of the place in which the average person lives. A good way of conceptualizing the difference between “standard density” and “perceived density” is that where standard density measures the average amount of land around each resident of a city, perceived density measures the average number of people around each resident of that city. Measuring perceived density involves four steps: 1. Divide the city into small geographic units such as census tracts. 2. Calculate the standard density of each of these census tracts. 3. Assign a weight to each census tract that is equal to its share of the total population of the city. 4. Average the weighted densities of all of the city’s census tracts. This produces a weighted or “perceived” density for the city.
The purpose of perceived density is to capture the density of the place in which the average person lives.
For the purpose of illustration, Bradford offers the extreme example of a fictitious city called “Metropolis.” Metropolis has a central core of 100,000 residents who live on ten square miles of land and a suburb with 10,000 residents who live on 100 square miles of land. The standard density of Metropolis is 1,000 people per square mile. However, since 90 percent of the population—those who inhabit the core—live in a very dense environment, this standard density number has little bearing on the way most residents experience their city. By giving the core’s density a weight of 90 percent and the suburb’s density a weight of 10 percent—weights that are equal to the respective proportions of the city’s residents that inhabit each part—we get an adjusted density of 9,100 people per square mile, a number that more closely approximates the density at which the average resident of Metropolis lives.
Perceived Density Ranking of U.S. Urbanized Areas
Using data from the 2000 U.S. Census, Bradford calculated the perceived densities of the largest urbanized areas in the U.S. He began with data for each census tract that is partially or wholly contained within each of the urbanized areas. He then calculated each census tract’s share of the urbanized area’s total population. From there he assigned each census tract a weight equal to its share of the population and averaged the weights to get the perceived density for the urbanized area. Table 2 below shows the perceived densities of the 15 largest urbanized areas in the US.
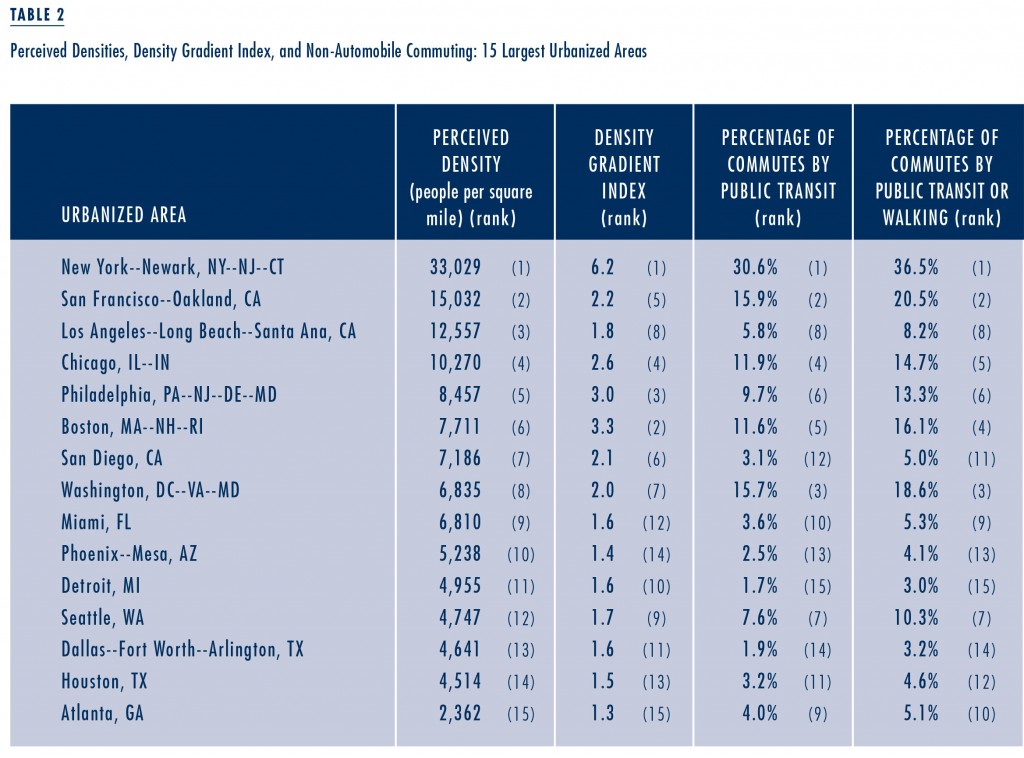
The resulting measures of perceived density probably align more closely with common perceptions of urban density. New York ranks head and shoulders above other urbanized areas, with a perceived density of over 33,000 people per square mile. San Francisco comes in second, with a perceived density of over 15,000 people per square mile, while Los Angeles drops from first place to third, with a perceived density of about 12,500 people per square mile. This ranking may still strike many as surprisingly high, given that Los Angeles remains ahead of cities that most people would intuitively think of as being dense, including Chicago, Philadelphia, Boston, and Washington, D.C.
Density Gradient Index
Bradford pushed the concept of perceived density a step further by developing the density gradient index. The density gradient index, which is the ratio of perceived density to standard density, is an indication of the unevenness of population distribution—or, to use Bradford’s terminology—a measure of “clumpiness.” Table 2 also shows the density gradient index for each urbanized area.
Not surprisingly, New York is also the urbanized area with the highest density gradient at 6.2. Interestingly, the urbanized areas with the next highest density gradients after New York are Boston and Philadelphia—neither of which make even the top ten for standard density, and which only rank sixth and fifth, respectively, in terms of perceived density. The source of Boston and Philadelphia’s high density gradients is almost certainly their age and their resulting urban design; they are older cities with large downtown cores and extensive public transit systems that were developed prior to the automobile era. As a result, development in these urbanized areas naturally clustered around their public transit lines, and the distribution of density within them is therefore very “clumpy” in comparison to cities like Los Angeles, Phoenix and Miami that experienced their greatest period of growth after auto ownership had already become widespread.
The source of Boston and Philadelphia’s high density gradients is almost certainly their age and their resulting urban design.
Bradford did a regression analysis to analyze the relationship between perceived density and commute mode (the final two columns of Table 2). He found virtually no association between standard density and the percentage of workers commuting by public transit or walking, but a strong association between perceived density and commuting by transit or foot, and an even stronger association between the density gradient index and the percentage of workers commuting by transit or by foot.
Conclusion
Many urbanists admire places like Boston, New York and San Francisco, which give their residents a wide range of transportation options and have charming multimodal streets. Many urbanists admire Los Angeles as well, of course, but recognize that it is often a difficult place to walk, bike or use public transportation. However, planners who seek to emulate Boston or New York, or to avoid the less desirable elements of LA, will go astray if they simply focus on increasing density. The urban form of older metropolitan areas is one of great variance, not great density. The New York urbanized area offers its residents both a super-dense, vibrant core and a low-density suburbia. The places where land is used very intensively in the center often see it used much less intensively on the outskirts. While it is possible to have an area that contains nothing but extraordinarily high density, such places are unusual, and often islands (think Hong Kong or Singapore).
Acknowledging these land use patterns should make us question some conventional planning goals. We might say we want more density or less sprawl. We might even say that we simply want more places to look like San Francisco or New York. But what exactly are we trying to accomplish by doing this? Do we want super-dense urban centers, or very-low density suburbs, or both? These aren’t easy questions to answer, and standard measures of density will offer us little help in trying to answer them.
No measure of density, no matter how comprehensive, can capture every dimension of sprawl.
It is also important to realize that no measure of density, no matter how comprehensive, can capture every dimension of sprawl. Much of what we consider sprawl is determined less by the density of people or jobs, and more by how buildings and parking are arranged on the street, and whether streets are designed in a way that makes walking and biking safe and comfortable. Nevertheless, in the future planners and policymakers might find it useful to assess the perceived density of the places they are trying to improve. Policymaking is about people, after all, so perhaps we are better off examining density as people experience it.
Further Readings
Gary Barnes. 2001. “Population and Employment Density and Travel Behavior in Large U.S. Cities.” Minnesota Department of Transportation, September.
Eric Eidlin. 2005. “The Worst of All Worlds: Los Angeles and the Emerging Reality of Dense Sprawl,” Journal of the Transportation Research Board, No. 1902, pp. 1–9.
Paul Sorenson. 2009. “Moving Los Angeles,” Access, Vol. 35, Fall, pp. 16–24.
Peter Newman and Jeffrey Kenworthy. 1999. Sustainability and Cities: Overcoming Automobile Dependence. Washington, DC: Island Press