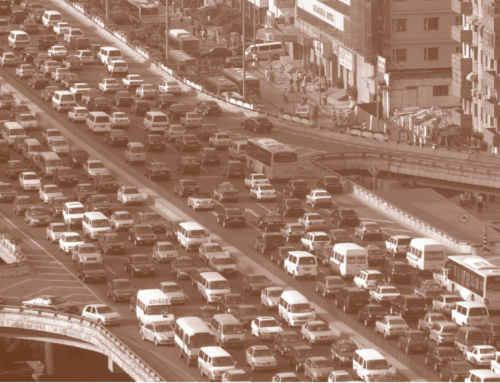
California is planning to spend $40 billion to build a high speed rail system from San Diego to Sacramento. Advocates argue that high speed rail will save money and improve the environment, while critics claim it will waste money and harm the environment. What accounts for these diametrically opposed views about a technology that has been operating in other countries for decades? And what can transportation analysts offer to inform the debate?
Disagreements about the cost and environmental impacts of high speed rail can arise when analysts examine only the most direct effects of the rail system, and compare those to only the direct effects of road and air travel—-the two transportation modes from which high speed rail will likely draw passengers. But transportation energy use and emissions result not only from the direct effects of operating the vehicles but also from indirect effects, such as building the infrastructure, producing the fuels, manufacturing the vehicles, maintaining the system, and disposing of materials at the end of their lives. The full range of emissions from automobile travel, for example, includes not only tailpipe emissions but also the emissions created by building roads and parking garages, manufacturing cars, extracting and refining petroleum, and, finally, wrecking yards and tire dumps. One approach to environmental and cost-benefit analysis that takes both these direct and indirect effects into account is life-cycle assessment. In this article we use life-cycle assessment to compare the energy use and pollution emissions of high speed rail and its competing modes.
 Life-Cycle Versus Narrower Accounting Approaches
When analyzing the environmental effects of planes, trains or automobiles, the normal approach is to measure tailpipe emissions. Researchers can estimate these emissions with a variety of methods, and then combine the emissions data with information about typical vehicle occupancy. Together, these data can be used to calculate the emissions per passenger-kilometer of travel for each mode.
The problems with this approach are twofold. First, it often ignores the large differences within modes. The environmental costs of cars, for example, will vary with drive cycles, technology, age, and the composition of the fleet. So while it may be tempting to say that one mode is simply better than another, environmental policy should recognize that no mode is universally good or bad, and that environmental impacts will depend heavily on context. Second, the conventional approach to evaluating modes depends heavily on estimates of ridership or occupancy. But calculating ridership is always hard, and for an entirely new system, such as California’s high speed rail, the task is particularly challenging. Because the system doesn’t exist yet, ridership estimates are less certain, forecasted from surveys and travel demand models rather than extrapolated from existing data. But even small adjustments to ridership estimates (or, for cars, occupancy estimates) can substantially change an environmental impact analysis. For example, how should we evaluate a new rail track that will last for decades? The track will likely facilitate many vehicle-kilometers of travel, but the emissions per passenger-kilometer will depend crucially on how many people will ride the trains. But even our best ridership estimates are uncertain, so picking a number and settling on it creates a false sense of precision. It is both more useful and more honest to evaluate different modes based on a range of possible ridership estimates.
How should we evaluate a new rail track that will last for decades?
The Life-Cycle Lens
Taking life-cycle and ridership uncertainty into account can yield drastically different estimates about the energy efficiency of different transportation modes. To illustrate this point, we assembled comprehensive data on energy use for 30 different on-road, rail, and air transportation modes, ranging from small automobiles to large aircraft. For each mode, we have information for 79 unique life-cycle components, including not just operating the vehicles, but also manufacturing the vehicles, constructing the infrastructure, performing maintenance, and producing fuel. For each mode at each life-cycle stage, we have quantified the energy inputs and emissions of greenhouse gases, sulfur dioxide, carbon monoxide, nitrogen oxides, volatile organic compounds, and particulate matter. Some of our results are shown in Figure 1, and they demonstrate the importance of considering both indirect impacts and ridership estimates.
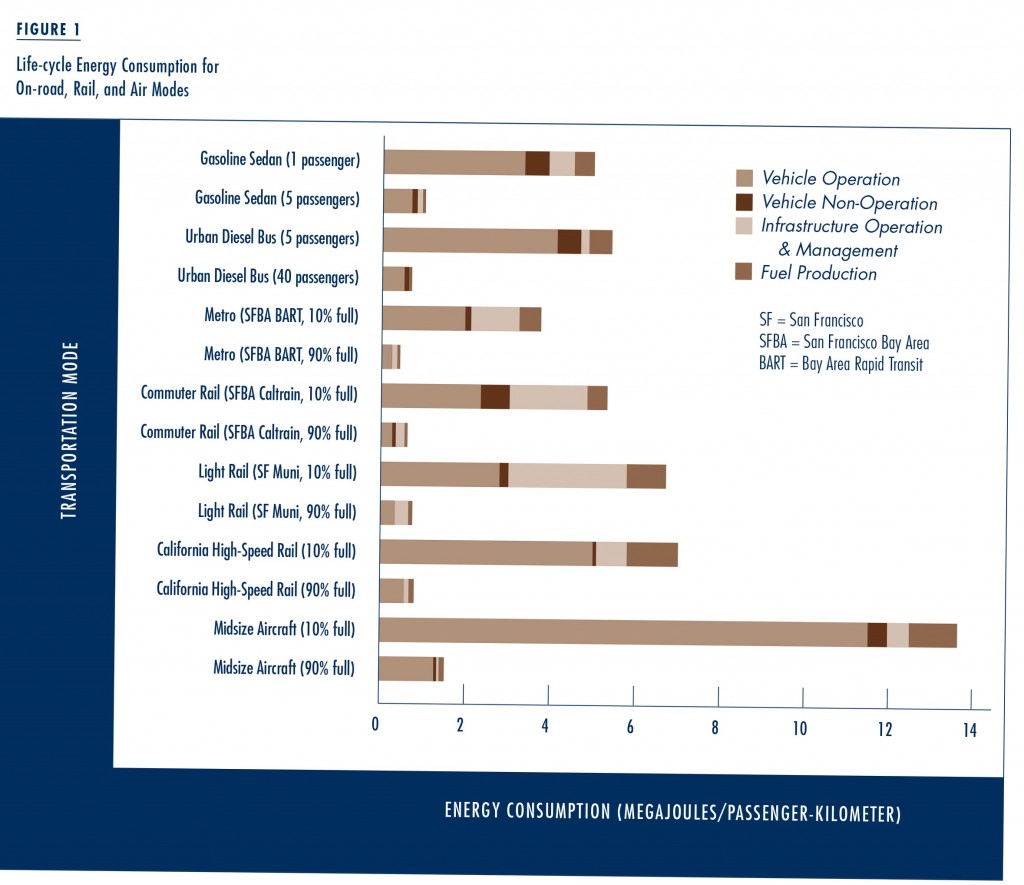 For example, light rail with 90 percent occupancy would compare favorably with just about any other mode if we consider only the energy expended and emissions created in operating the system. But building the infrastructure and producing the fuel essentially doubles the energy intensity of light rail. And if we change our assumptions furtherand assume that the light rail system will be only 10 percent full, as opposed to 90 percent, then light rail starts to look much worse, and is less environmentally beneficial than a gasoline sedan with a solo driver.
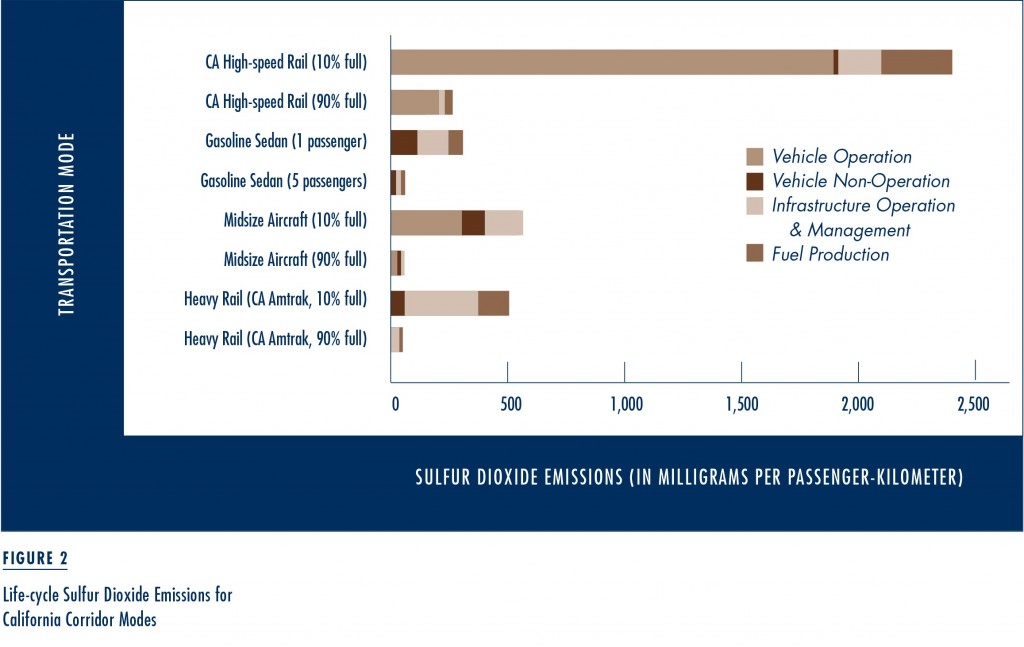
Regulations have greatly reduced sulfur levels in fuels, so the majority of sulfur dioxide emissions now come from burning fossil fuels to generate the electricity needed to manufacture vehicles, build and operate infrastructure, process materials, and produce fuel.
The reasons for the large non-operating impacts vary. Regulations have greatly reduced sulfur levels in fuels, so the majority of sulfur dioxide emissions now come from burning fossil fuels to generate the electricity needed to manufacture vehicles, build and operate infrastructure, process materials, and produce fuel (see Figure 2). In fact, the majority of sulfur dioxide, carbon monoxide, volatile organic compounds, and particulate matter emissions now come not from vehicle operation but from other life-cycle components. For bus, rail, and air modes, producing and transporting cement (for roads and runways) can produce more carbon monoxide than operating the vehicles. And airport equipment, such as baggage tractors, can generate three to nine times more carbon monoxide emissions than actually flying the aircraft.
 A life-cycle analysis also allows us to see the environmental impacts of a given transportation mode far beyond where the travel occurs. For example, manufacturing a car or propelling a train requires electricity, and the fossil fuels burned to generate that electricity produce sulfur dioxide emissions that can harm human health outside the regions where people drive the cars or ride the trains. Similarly, particulate matter emitted from a hot-mix asphalt plant harms people near the plant, rather than where travel occurs. When we evaluated the life-cycle externalities associated with the healthcare costs of treating exposure to emissions from urban travel, we found that the external costs of travel were as high as 11¢ per passenger-mile for automobile trips and 19¢ per passenger-mile for public transit trips. While these worst-case costs occur only when the highest environmental impact and lowest ridership are assumed, the assessment suggests the importance of encouraging passengers to shift to cleaner and higher-ridership modes.
Life-Cycle Analysis of California High Speed Rail
The proposed California high speed rail system offers an opportunity to compare new rail transportation infrastructure against continued growth in auto and air travel. Most of the high speed rail debate centers on the cost of building the system, with little attention paid to the cost of some alternatives, such as expanding the road and air infrastructure in the corridor or using congestion pricing on roadways and peak landing fees at airports. California’s population is expected to increase significantly in the next half century, and the demand for travel will likely rise as well. High speed rail will divert some of this additional travel demand from auto and air modes, but will doing so benefit the environment? Life-cycle analysis can provide the broader understanding needed to answer this question by considering more than only vehicles and fuels.
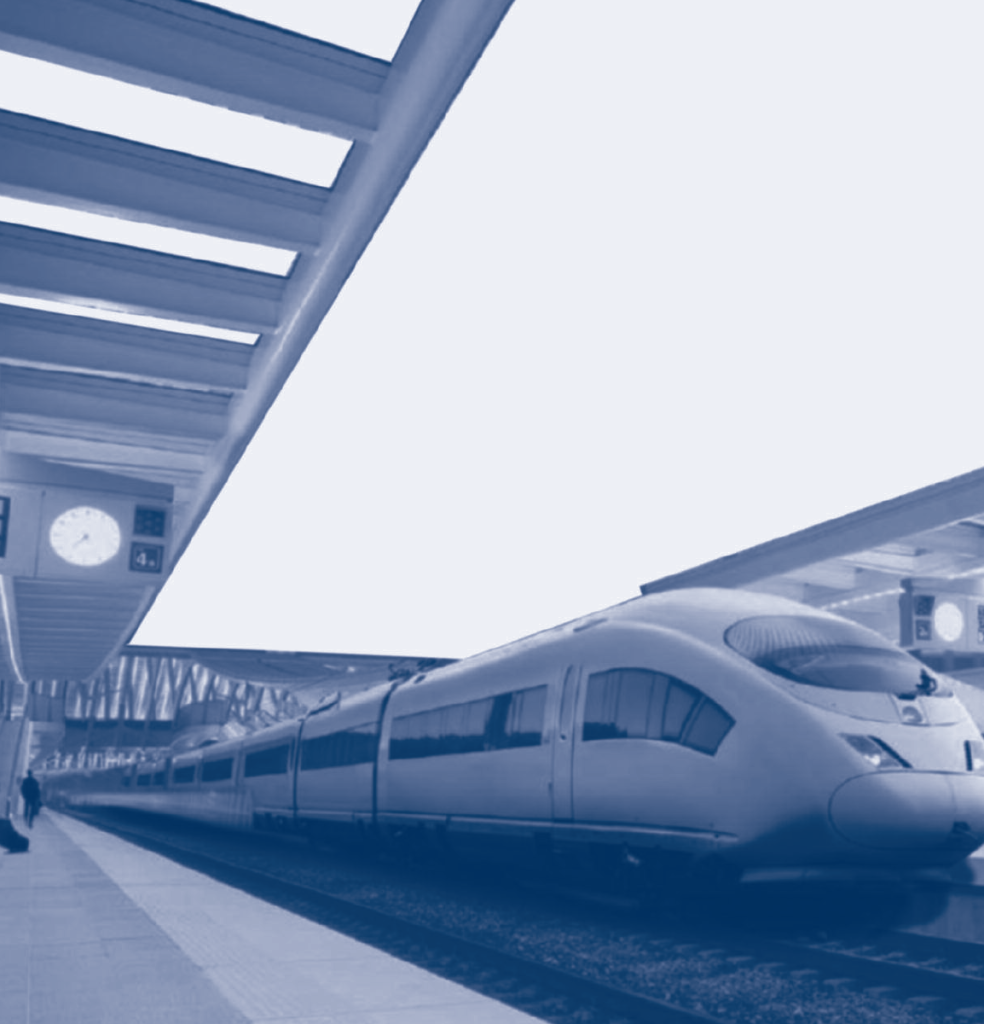
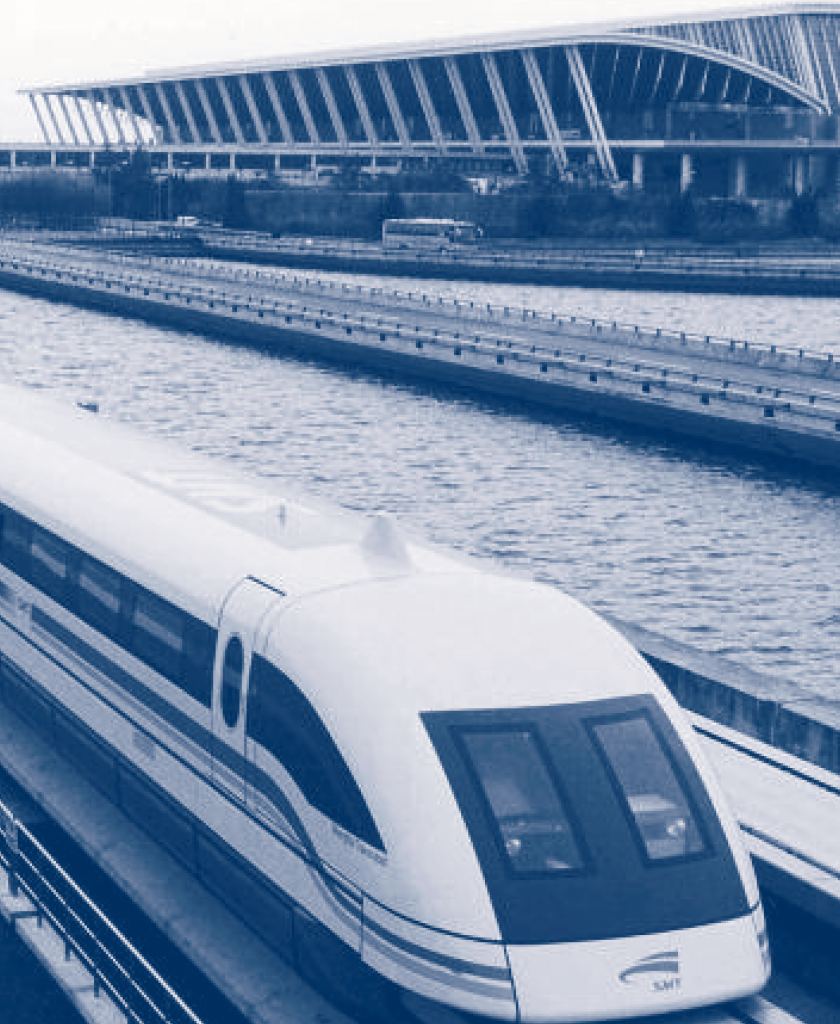
 We have developed a life-cycle inventory of high speed rail, automobiles, heavy-rail (Amtrak), and aircraft in the California high speed rail corridor from San Diego to Sacramento. Currently, autos account for 75 percent of corridor’s total passenger travel, air 24 percent, and heavy rail only 1 percent. Our life-cycle inventory evaluates the vehicle, infrastructure, and fuel components of all these modes, and takes into account conditions that are specific to California: how the vehicles used here are made; the source of electricity behind the various modes; and typical ridership levels for in-state long-distance trips. A key factor is the cleanliness of the electricity used by each mode. High speed rail proponents have recently acknowledged the need to augment any new train infrastructure with investments in wind and solar electricity generation in order to reduce emissions. But the high speed rail authority has no clear directive to use renewable electricity, so we assumed that high speed rail will use the current regional electricity mix. We also assumed the rail line will operate 1,200-seat trains as indicated in the California High Speed Rail Authority’s environmental impact statements. These are big trains: European and Japanese high speed trains often seat 600 or fewer passengers.
High speed rail proponents have recently acknowledged the need to augment any new train infrastructure with investments in wind and solar electricity generation in order to reduce emissions.
The life-cycle inventory for high speed rail shows that accounting for infrastructure construction and electricity production adds 40 percent to the energy consumed by the trains’ operations alone (see Figure 1). Greenhouse gas emissions increase by about 15 percent, primarily because of the concrete used in construction—half a kilogram of CO2 is emitted for every kilogram of cement produced. Infrastructure construction will emit roughly 490 million metric tons of greenhouse gases, which are approximately 2 percent of California’s current annual emissions. As was the case with the life-cycle inventory of conventional modes, the majority of emissions are released not from the electricity needed to propel the high speed trains, but from the indirect and supply-chain components.
We can estimate the energy payback period for high speed rail by comparing the energy used in its construction with the resulting energy savings in its operation, but only by making assumptions about ridership. The payback period evaluates the upfront energy or emission investment in deploying high speed rail infrastructure against the potential reductions over time. The California High Speed Rail Authority provides a ridership estimate, but as we noted above, ridership is uncertain, and for an entirely new mode it is very uncertain. Thus California high speed rail warrants ridership evaluation for both high- and low-ridership scenarios. We consider high ridership as strong adoption of high speed rail at the expense of auto and air travel, mid-level ridership as moderate adoption of high speed rail, and low ridership as poor adoption of high speed rail where travelers favor auto and air. For high ridership scenarios, the energy payback period on the initial investment is eight years, for mid-level ridership 30 years, and never for low ridership (when under-used high speed rail is coupled with increased utilization of auto and air travel). For greenhouse gas emissions the payback period for rail is six years for high ridership, 70 years for mid-level ridership, and never for low ridership. Sulfur dioxide emissions, primarily from electricity production throughout the life-cycle, show a surprising payback result; there is no reduction in sulfur dioxide emissions for any rail ridership scenario if electricity continues to be generated and supplied as it is currently.
Thus the California high speed rail system can reduce greenhouse gas emissions, but may do so only over a very long period, and will do so in exchange for other air emissions. This dilemma illustrates the potential pitfall of tackling reductions of one pollutant, like carbon emissions, without considering other emissions. Building high speed rail to reduce carbon emissions should also include co-investment in clean electricity to avoid unintended consequences like increases in sulfur dioxide. The life-cycle assessment framework highlights the pitfalls of shifting emissions from the tailpipe to other processes, and evaluating the new rail system prior to design offers direction for minimizing effects in the larger transport system.
Systems-Oriented Policy Analysis
Energy and emissions policies have often been adopted with little recognition that one negative environmental impact is often being traded for another. The addition of MTBE as a fuel oxygenate in the 1990s and the more recent use of corn-ethanol are two prime examples. Rigorous life-cycle assessment of either fuel additive would have revealed tradeoffs, which for both were realized only after widespread use. The decision to use MTBE to improve air quality failed to consider the fuel additive’s release into groundwater supplies when stored in leaky underground tanks. And the broad agricultural, economic, and environmental food-versus-fuel tradeoffs of corn ethanol are only now beginning to be understood.
Life-cycle assessment shows that high ridership coupled with planning for system-wide energy and emission reductions are necessary for a high speed rail network to improve the environment and human health.
For California high speed rail, life-cycle analysis offers a way to identify tradeoffs early in the policy development and planning phases. Our life-cycle analysis of California high speed rail shows that its total energy use and greenhouse gas emissions per passenger-kilometer will be significantly underestimated if analysts consider only operating the trains, and if they over-estimate the ridership. Extensive use of concrete and other materials, transportation of parts and materials in the supply chain, and electricity generation for many interrelated processes will consume much energy and produce much pollution before the trains begin transporting passengers. Accounting for these life-cycle effects and for the large range of potential ridership shows that California high speed rail can be either better or worse for the environment than air or car travel. It is critical that before deploying high speed rail, several key factors are comprehensively examined to ensure the system environmentally outperforms existing modes. These factors include the use of more frequent, smaller trains coupled with station placement that incorporates long-term regional planning and existing transit integration to promote high ridership. Electricity for trains and infrastructure should be generated from clean sources. And for infrastructure construction, the environmental impacts of certain materials, like concrete, should be minimized. Furthermore, mode shifting behavior and indirect effects including reduced congestion should be considered. Life-cycle assessment shows that high ridership coupled with planning for system-wide energy and emission reductions are necessary for a high speed rail network to improve the environment and human health.
Further Readings
Mikhail Chester and Arpad Horvath. 2010. “Life-cycle Assessment of High- Speed Rail: the Case of California,” Environmental Research Letters, 5 (1).
Mikhail Chester and Arpad Horvath. 2009. “Environmental Assessment of Passenger Transportation Should Include Infrastructure and Supply Chains,” Environmental Research Letters, 4 (2).
Mikhail Chester, Arpad Horvath, and Samer Madanat. 2010. “Comparison of Life-cycle Energy and Emissions Footprints of Passenger Transportation in Metropolitan Regions,” Atmospheric Environment, 44 (8).
David Brownstone, Mark Hansen, and Samer Madanat. 2010. “Review of ‘Bay Area/California High-speed Rail Ridership and Revenue Forecasting Study,’” Research Report UCB-ITS-RR-2010-1, Institute of Transportation Studies, University of California, Berkeley.
Mikhail Chester, Arpad Horvath, and Samer Madanat. 2010. “Parking Infrastructure: Energy, Emissions, and Automobile Life-cycle Environmental Accounting,” Environmental Research Letters, 5 (3).