[sharelines]Fuel efficiency or safety? Enacting the right policies means, when buying a car, you won’t have to choose.
The United States has strengthened its fuel efficiency regulations several times in recent years in an effort to reduce the environmental, economic, and energy security costs associated with gasoline. These standards encourage automakers to increase fuel efficiency by using advanced technology and by manufacturing lighter, lower-horsepower vehicles.
But are these new fuel-efficient vehicles safe?
Traffic accidents killed more than 32,000 Americans in 2011, representing the leading cause of death for those under 40. They also caused two million non-fatal injuries. Given the large scale of traffic deaths and injuries, fuel efficiency regulations that produce even small percentage changes in safety, in either direction, can have a dramatic effect. I find that even subtle changes in the policy, for example the way pickup trucks or vehicles with larger footprints are treated, can importantly influence safety.
Traffic accidents killed more than 32,000 Americans in 2011, representing the leading cause of death for those under 40. They also caused two million non-fatal injuries.
To measure the safety of the increasingly fuel-efficient US fleet, I studied the link between fleet composition and accidents, examining safety implications for both car occupants and occupants of other vehicles. In my research, two key patterns emerged: 1) in single-car crashes (which make up more than half of fatalities), smaller and lighter cars are more vulnerable to damage than larger vehicles, and 2) smaller and lighter cars involved in multiple-car crashes are much less likely to cause a fatality in other vehicles.
I examined the safety effects of an increase in the gasoline tax as well as three different types of fuel economy policy: a simple average fuel efficiency requirement, the historical Corporate Average Fuel Economy (CAFE) standards, and the recent “footprint-based” policy that is being phased in through 2025.
US Fuel Economy Policy
The US has embarked on the most ambitious reduction of gasoline use since the 1978 CAFE standards, with a target for 2025 that nearly doubles the average fuel efficiency of new vehicles sold relative to 2010. These rules place an upper limit on the average fuel consumed per mile driven in the mix of new vehicles sold or, equivalently, a lower limit on miles per gallon (MPG).
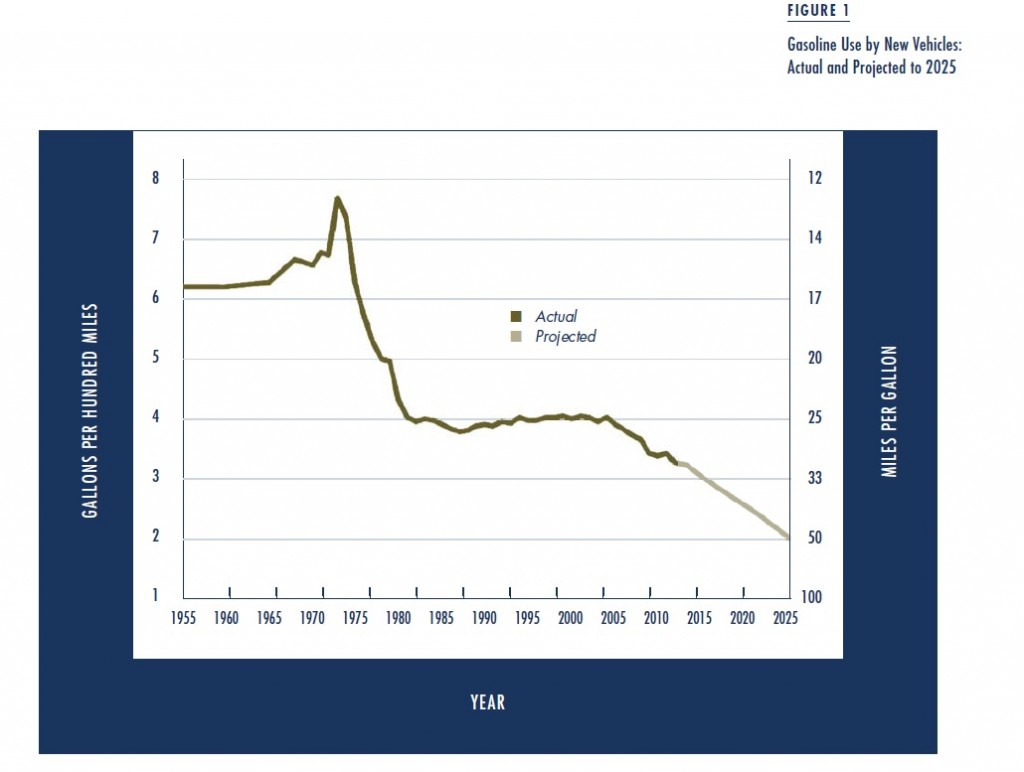
Figure 1 plots fuel use per 100 miles (this measure is proportional to overall gasoline use in the country controlling for the number of drivers and distance traveled) among new vehicles sold in the US since 1955. This figure shows both the historical effects of the 1978 CAFE standards as well as the requirements of new standards through 2025. Corresponding changes in the more familiar MPG measure are shown on the right-hand scale. Notice that MPG improvements save more fuel when MPG is low to start with. For example, Figure 1 shows that when the initial fuel efficiency was 14 MPG, an increase of 3 MPG to 17 MPG saved one gallon of gasoline per 100 miles traveled. When the initial fuel efficiency is 33 MPG, however, it will take a further increase of 17 MPG to 50 MPG to save another one gallon per 100 miles traveled.
Most notably, there is a sharp decline in fuel consumption following oil price increases during the 1970s supply crisis. Average fuel use fell from over seven gallons for a 100-mile trip to fewer than four gallons in the late 1980s. This drop was followed by a slow rebound in fuel use, which ended with the 2005 spike in gasoline prices.
There is a sharp decline in fuel consumption following oil price increases during the 1970s supply crisis.
Economists largely agree that without CAFE standards gasoline use would have risen much faster during the 1990s and early 2000s. CAFE regulations held the fuel use of two broad categories—passenger cars and light trucks—almost constant. The small increase in fuel use between 1987 and 2004 reflects a shift in the fleet from passenger cars to light trucks, a category that includes SUVs, pickups, and minivans.
Figure 1 also displays the ambitious fuel economy standards that will be phased in by 2025. These standards extend the gasoline-saving trend that began in 2005 and will eventually reduce fuel consumption to only two gallons for a hundred-mile trip, or around 50 miles per gallon. Additionally, a new feature of the rules—measuring average fuel economy based on the size of each vehicle—will significantly change the way fuel economy standards influence fleet composition.
Accident Safety and Fleet Composition
Through the 1980s and 1990s, American consumers bought larger vehicles in part as a defense against other large vehicles. As a result, a slow but costly arms race has taken place in the US vehicle fleet. The fleet we have today is composed of vehicles that are, on average, about 1,000 pounds heavier than they were in 1980.
Gasoline-saving policies, however, encourage the purchase of smaller and lighter vehicles. At first glance, this would seem to worsen safety, as crash tests highlight the risks of small vehicles. On the other hand, economists Michael Anderson and Maximilian Auffhammer, who also have an article in this issue, estimate that making a car 1,000 pounds lighter reduces the risk of causing a fatality in another car by 50 percent. Thus, fuel economy policies, by promoting smaller and lighter vehicles, have the potential to reduce this arms race and increase overall safety.
Smaller cars may offer less protection to their own occupants but they also greatly reduce fatalities for people in other vehicles. To assess the effect of fuel economy policy on vehicle safety, I measure the following three key factors: 1) how well each type of vehicle protects its own occupants, 2) the risk each vehicle type imposes on others, and 3) the risks posed by individual drivers when they select different vehicle types. This last consideration is essential when working with real-world accident data because drivers who choose different vehicle types often have very different risk factors due to different driving behavior.

Using a comprehensive dataset of fatal traffic accidents in the US, I considered the safety impacts of consumers’ switching among car types, such as from larger sedans to compact cars.
A large fraction of fatal accidents occur on rural roads.
The key challenge in using accident data comes from the risks imposed by drivers themselves. For example, a large fraction of fatal accidents occur on rural roads. Therefore, safety data for the large pickups and SUVs often chosen by rural drivers will partially reflect the dangers of rural driving rather than the vehicles’ inherent safety. A host of other confounding factors also exist, such as the vehicle choices and driving behavior of younger drivers, night drivers, drunk drivers, or distracted drivers. These important factors are often unobserved in the data. My technique to isolate them involves a statistical comparison of fatal accident rates across all pairs of vehicles (for example pickups vs. compacts and pickups vs. minivans) with rates of single-vehicle accidents.
The results of my analysis of driver risk confirm the intuition many already have. For example, minivan drivers appear the safest among all classes, with accident risks that are approximately one third of the average. This captures unobserved attributes of minivan drivers such as the locations and times of day that they tend to drive. Likewise, small SUV drivers have very low risk for fatal accidents—about half of the average—perhaps because they tend to locate in urban areas. Drivers of different types of sedans are generally more similar to one another, with slightly more risk coming from drivers of larger, higher horsepower sedans.
After controlling for driver risk, I consider the risk each vehicle type imposes on others in the fleet. The results here are also intuitive: the accidents most likely to be fatal are those involving poorly matched vehicles. For instance, a pickup truck imposes about twice as much risk on a compact-car driver as a heavy luxury sedan does, and both luxury cars and pickups impose many times more risk than another compact car would. In single-car accidents, the largest sedans are safest (their heavy weight combines with low rollover risk), while small pickups have the greatest rate of fatal accidents even after controlling for the risk of drivers who choose them.
The accidents most likely to be fatal are those involving poorly matched vehicles.
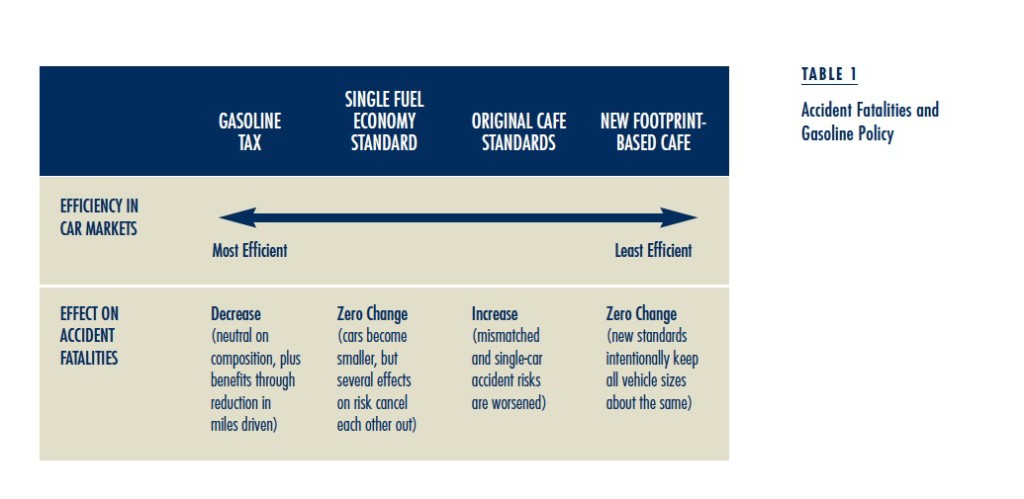
I combine these safety results with an economic model of US fuel economy rules. I then assess the safety effects of each type of policy, correcting for the changing distribution of people selecting different vehicle classes. For example, a policy might encourage some minivan drivers (with their safe driving habits) to switch to large sedans. The newly combined group of sedan drivers will then have lower average risk, reducing the overall rate at which large sedans appear in fatal accidents. I account for similar changes (for both better and worse) across all vehicle classes in my results. Table 1 summarizes these findings for four gasoline-saving policies, arranged from most to least efficient (before considering safety).
Policies
Gasoline Tax
An increase in the gasoline tax is the most efficient policy since it encourages gasoline saving at multiple decision points: consumers will drive less and also choose more fuel-efficient cars. An increased gasoline tax will increase demand for cars that are smaller, lighter, and that contain efficient engine technologies, while reducing the demand for SUVs, pickups, and minivans. Although it is the most economically efficient, an increase in the gasoline tax faces considerable political opposition. US policy therefore focuses on fuel economy standards.
An increase in the gasoline tax is the most efficient policy since it encourages gasoline saving at multiple decision points: consumers will drive less and also choose more fuel-efficient cars.
Single Fuel Economy Standard
The most flexible and efficient standard is a single rule that simply requires a higher average fuel economy among all vehicles sold. This policy is the second most efficient of the options and would encourage fuel saving technology, smaller vehicle sizes, and fewer trucks and SUVs. In spite of this flexibility, a single average standard is less efficient than a gasoline tax since it changes car choice but fails to encourage people to drive less.
Original CAFE Standards
Unlike a single average fuel economy standard, the original CAFE standards separate light trucks (pickups and SUVs) from sedans. This additional complexity means that the CAFE standards are less efficient than imposing a single average rule. Manufacturers can no longer switch away from pickups and SUVs in order to improve their fuel economy rating so they must be stricter along other dimensions, such as size changes and new technologies.
New Footprint-Based CAFE Standards
Finally, the new footprint rules that are in place in the US until 2025 are the least efficient in terms of the flexibility they allow in meeting the goal. The required fuel economy for each vehicle is based on its physical dimensions, meaning that smaller cars are held to higher standards. This removes the incentive for manufacturers to change fleet composition toward smaller vehicles, instead leading them to focus almost exclusively on technological advances and weight and horsepower reductions.
Why move to a footprint-based policy that doesn’t encourage reducing vehicle size as a way to save gas? According to the National Highway Traffic Safety Administration, the footprint-based policy was created to mitigate “the potential negative effects on safety.” Without incentives to move to smaller cars, however, the main changes under the new rules will be features like engine technology and aerodynamics. The sizes and shapes of vehicles, and also accident outcomes, will be held roughly constant.
Safety Implications
Table 1 also shows safety outcomes for each of the four policies. Perhaps the most encouraging result is that a simple, average fuel economy standard involves almost no change in the total number of fatalities. The average standard encourages smaller and lighter vehicles, which worsens single-car accident outcomes, but it also slows down the vehicle arms race. When there are fewer large vehicles, there are also fewer accidents between large and small vehicles. Since large-small vehicle accidents are by far the most dangerous accident type, reducing their frequency via the fuel economy policy creates a dramatic safety improvement.
When there are fewer large vehicles, there are also fewer accidents between large and small vehicles.
The original CAFE standard is less flexible and more costly than a single standard or gasoline tax, and it creates the worst accident outcomes among all four policies. This policy maintains the dangerous mismatches in two-vehicle accidents while still worsening risks in single-vehicle accidents because of lower weights within each vehicle category.
Conclusion
Several policy options, including new footprint-based standards now going into effect, can reduce gasoline use while maintaining or even enhancing safety. More important, there also appears to be no clear tradeoff between the economic cost of a policy and safety. This result is striking as we might expect that economically “cheap” policies for saving gasoline (involving lots of people moving to smaller cars) would also require us to sacrifice safety. In fact, the opposite is true. The most efficient ways for the US to save gasoline—a simple tax increase or an average fuel economy standard—also provide the best outcomes in terms of safety.
This article is adapted from “Fuel Economy and Safety: The Influences of Vehicle Class and Driver Behavior,” originally published in American Economic Journal: Applied Economics.