Traffic lies at the heart of many fears about new urban development. In some cases, cities require developers to scale back housing or retail proposals to alleviate concerns about congestion. In other cases, cities widen roadways, add turn lanes, or lengthen signal cycles to accommodate projected traffic volumes.
In both instances, planners and engineers wield considerable influence through their predictions of the number of vehicle trips that a proposed development will generate. This seemingly mundane process—trip generation analysis—profoundly shapes the physical form and financial feasibility of urban development. Estimates of trip generation help shape the road infrastructure, determine the amount that developers must pay for new roads and greenhouse gas mitigation, and sway local support or opposition to proposed development. Trip generation practices also help determine how much urban space cities dedicate to cars; the viability and character of transit-oriented and infill development; and whether a project proceeds at all.
How do we predict how much more traffic there will be? In the United States, the Institute for Transportation Engineers’ (ITE) Trip Generation Manual, now in its 9th edition, is the standard reference. It provides data on the number of trips generated by 172 different land uses, from “Baby Superstore” to “Cemetery.” Some of the land-use categories are remarkably specific, such as “Batting Cage” or even “Coffee/Donut Shop with Drive-Through Window and No Indoor Seating.”

Given the ubiquitous influence of the Trip Generation Manual on the built environment, it is important to understand the validity of its data and ITE’s recommended practices. Rather than accurately forecasting the impacts of new developments, I show in this article that ITE substantially overestimates trip generation rates. Moreover, I explain why ITE’s core premise, that development always generates new trips, is misleading in many circumstances. Because ITE rates do not fully consider how trips are reshuffled among destinations, they are often inappropriate for evaluating traffic, fiscal, and environmental impacts. In short, we are planning for “phantom trips” that never appear in reality.
Testing the Validity of ITE Rates
Transportation professionals have long recognized that ITE rates are not suitable for mixed-use centers, transit-oriented developments, or similar projects where many trips will be made by public transit, cycling, or walking. The ITE manual stresses this limitation, and agencies often allow developers to adjust down their trip generation rates in certain contexts.
But what about the wider validity of ITE’s trip generation rates? To date, these have gone unchallenged. Here, I compare national-level estimates of vehicle trips based on ITE rates with those from the 2009 National Household Travel Survey (NHTS)—the most comprehensive travel behavior survey in the US.
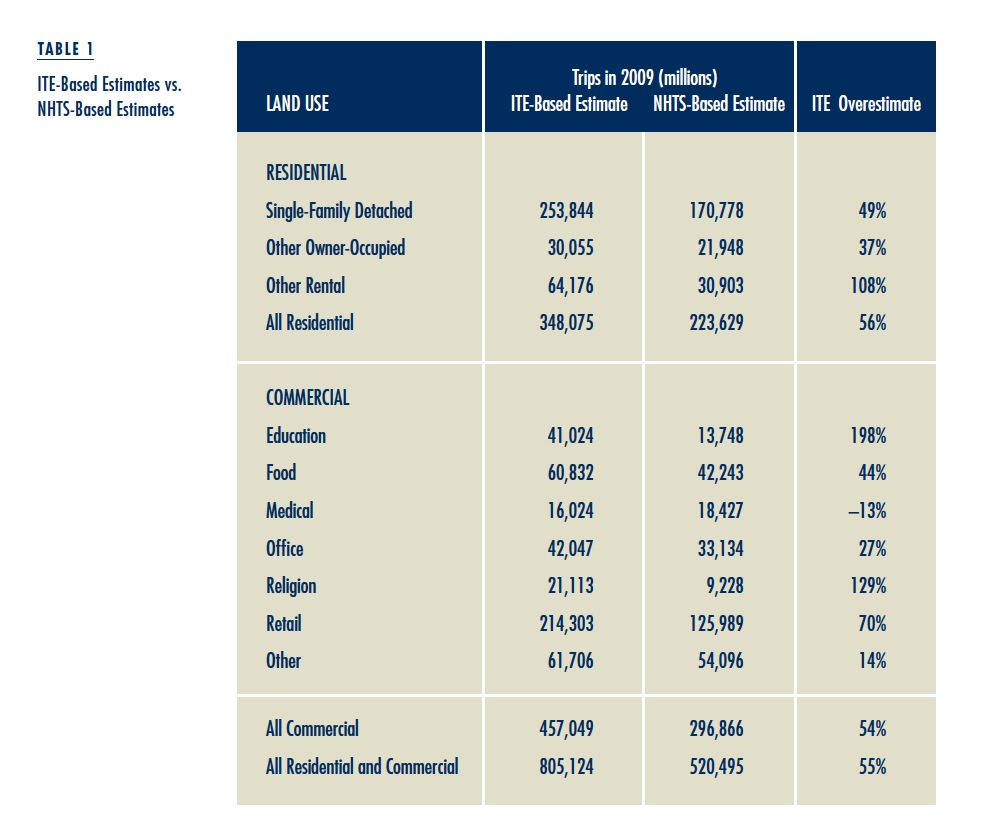
Comparing the two estimates of total trips in the US for a single year (2009) shows that the ITE-based method produces an estimate that is 55 percent higher than the NHTS. As shown in Table 1, this overestimate is present across all but one of the land-use types. Given the rigor and methodological transparency of the NHTS, coupled with an adjustment to match the totals in the Federal Highway Administration’s Highway Statistics, the NHTS-based method is likely to be more accurate than the ITE-based one. The results thus suggest that ITE substantially overestimates trip generation rates.
Explaining the Discrepancy
Lower trip generation rates from mixed-use and transit-oriented development, as discussed by Schneider and his colleagues in this issue, provide one possible explanation for the discrepancy between the ITE- and NHTS-based estimates. The data, however, suggest that this is not the primary problem with ITE’s rates. There is no indication that the ITE-based method is more accurate in more sprawling regions with less transit use, less walking, higher vehicle ownership, or lower residential density. Transit-oriented and mixed-use development, while undoubtedly inflating ITE’s trip generation rates, does not appear to be the primary reason for the overestimates.
A more compelling possibility is that the ITE trip generation rates are not based on a representative sample. The ITE data are compiled mostly from voluntary submissions of traffic counts from specific developments, making it likely that such data are biased towards more traffic-intensive sites. Such traffic counts are not conducted as a matter of course; some specific reason must exist to collect the data. Perhaps a large and controversial development required a traffic-monitoring plan as a condition of approval, or perhaps trip generation studies tend to be commissioned by cities or states where traffic is a particular concern.
These explanations remain somewhat speculative, as the Trip Generation Manual says almost nothing about the characteristics of the developments surveyed beyond their size, and ITE refuses to release further specifics, citing confidentiality constraints. Nonetheless, it seems likely that the data published in the Trip Generation Manual are far from a random sample of new developments.
ITE’s guidance on selecting sites for trip generation studies reinforces the idea that the data are biased. ITE recommends that developments where traffic counts are conducted should have “reasonably full occupancy,” “appear to be economically healthy,” be “mature,” and represent “the ultimate characteristics of a ‘successful’ development.” Using only data from well-patronized, successful developments to forecast the impacts of all new developments will naturally inflate trip generation rates. While developers do not intend to build unsuccessful projects with high vacancy rates and few customers, inevitably, not every development succeeds.
Marginal or Average Trips?
The comparison presented earlier was for a single year, 2009. However, the magnitude of the ITE overestimate appears to be increasing over time. From 1990 to 2009, the number of annual trips (or more precisely, trip ends) in the US increased by 89 million, according to the NHTS. But according to the ITE-based method, annual trips should have increased by 189 million—an estimate more than double that of the NHTS. The contrast is even starker in more recent years: an increase of 2 million trips between 2001 and 2009 according to NHTS, but 90 million by the ITE-based method.
These comparisons over time reveal a core problem with ITE’s approach. In recent years, household travel has plateaued or may even be falling, and several studies have concluded that we have reached “peak travel” in the US. Even if the pace of development has slowed since the last recession, however, residential and non-residential projects continue to be built. By ITE’s logic, each new house, apartment, office, and factory should be generating additional trips, thus leading to significant travel growth throughout the country. But in reality, total trip-making in the US has been relatively flat since 1995.
By ITE’s logic, each new house, apartment, office, and factory should be generating additional trips, thus leading to significant travel growth throughout the country. But in reality, total trip-making in the US has been relatively flat since 1995.
The fundamental issue is ITE’s core premise that new development always generates new trips. The implicit assumption in this model is that new destination opportunities spur households to make new trips, rather than merely substituting new destinations for old ones. In practice, new development has much more complex effects on total trip making. Some trips will be completely new, as households take advantage of new employment or recreational opportunities. But most trips substitute for existing ones—they are diverted from existing locations as people change where they live, work, and shop in the light of new travel options.
In other words, ITE’s data reflect the average trip generation rate, not the marginal trip generation rate. The average rate is simply the number of trips that could be expected at a development of a particular type. The marginal rate is the increase in total trips as a result of that same development. The marginal rate will typically be less than the average rate, because some new trips merely substitute for old ones. Engineers, planners and policy makers, however, often care more about the marginal trip generation rate, which tells us the net impact of a new development on traffic or greenhouse gas emissions.
Scale matters in this analysis. At the micro level—the newly constructed driveway or street that serves a new development—the projected trips are supplementary to what would have been there otherwise. In this case, the average rate will equal the marginal rate, so the distinction is of little import. But when we consider the macro level—trips on arterials and freeways—substitution becomes more important, and the marginal rate becomes less than the average rate. The larger the area of analysis, the greater the likelihood that the previous origin or destination lies within that area of analysis, and the more the marginal rate will diverge from the average rate.
Scale matters in this analysis. New development projects do not normally generate trips—or greenhouse gas emissions—at the regional or national scale, but simply reshuffle existing ones around.
Take, for example, the construction of a new courthouse. Presumably, the number of murders, divorces, and other legal matters—and thus the total number of trips to court—has little to do with the number of courthouses in a county. Courts do not cause crime. Nevertheless, the new courthouse will cause trips to be relocated from other facilities, and its location, transit access, and parking cost will influence the marginal number of trips. If the courthouse is located in a more transit-rich, denser center than before, the marginal impact may well be negative. None of this would be considered by simply looking up the average trip generation rate in the ITE manual.
ITE’s recommended practice in the Trip Generation Handbook partially recognizes issues of scale and, implicitly, the difference between average and marginal rates, by distinguishing between three types of trips: primary trips; pass-by trips to intermediate destinations, where the driver simply stops along the way; and diverted linked trips, which are similar to pass-by trips but involve a diversion. This framework, however, only partially captures the trip substitutions that cause the average rate to exceed the marginal rate, because even primary trips do not necessarily increase travel at the macroscopic scale. For instance, a primary trip to a new grocery store may substitute for a primary trip to the household’s previous store of choice.
In the case of local intersections, it might be justifiable to disregard the distinction between average and marginal trips. In the case of regional freeways, though, it is dubious to ignore trip substitutions. When considering entirely non-local effects like greenhouse gas emissions, the substitution component is almost completely dominant, and it is wrong to base an analysis on average trip generation rates. In this case, almost all trips are substituted from other origins and destinations, and marginal trips are negligible. New development projects do not normally generate trips—or greenhouse gas emissions—at the regional or national scale, but simply reshuffle existing ones around.
Conclusion
ITE’s Trip Generation Manual represents standard practice when analyzing the traffic and environmental impacts of new development. Most criticism has focused on the inapplicability of ITE trip generation rates to mixed-use and transit-oriented development. However, I find that the problems with ITE trip generation rates run far deeper.
First, the rates appear to greatly overestimate the number of vehicle trips that can be attributed to any development project, most likely because ITE’s data are based on a biased sample. Engineers and planners who use ITE rates are likely designing streets to cater for phantom trips that will never materialize.
Second, trip generation rates published by ITE must be interpreted as the average rate, not the marginal rate, and the marginal rate depends on the scale of the analysis. This is largely a criticism of standard practices in traffic engineering and air quality analysis, rather than the quality of ITE’s data. Indeed, at scales beyond the immediate vicinity of a particular development, it makes little sense to think in terms of trip generation. By calling this process “generation,” we mislead people into thinking new trips are created as a direct result of development activities. But new land uses do not generate trips in a mechanistic way. Instead, people generate trips, in response to the characteristics of the built environment rather than the amount of development.
What, then, is the practicing planner or engineer to do? Regional travel demand models provide an option for large projects, but are likely to be too costly for smaller developments. For analysis of traffic movements at intersections adjoining a new development—the bread and butter of traffic engineering practice—it would be wise to bear in mind that ITE trip generation rates are likely to lead to large overestimates. Preferably, the analyst would seek sources of trip generation data that are tailored to the local characteristics of a particular development.
An altogether different approach is needed for analysis of traffic, air quality, or greenhouse gas emissions at a scale beyond the immediate vicinity of a development project. Instead of conceptualizing new housing, offices, or retail centers as generating traffic or emissions, it seems more useful to judge them against the baseline of existing development.
In a sprawling metropolitan region, new high-density, transit-oriented housing will probably reduce total vehicle travel. Adjusting down the number of trips generated for developments of this nature is certainly a step in the right direction, but fundamentally it is misleading to think that such transit-oriented housing generates any additional vehicle trips at a regional scale. A more reasonable starting point is to consider that new development is just as likely to reduce traffic, air pollution, and greenhouse gas emissions as it is to increase them.
Traffic levels in the US have plateaued while development is rebounding following the economic downturn. When considered together, these two trends are incompatible with the idea that new development “generates” traffic at any scale beyond the very local. But current planning practices demand that roadway infrastructure be designed, and developers assessed fees, to accommodate both actual and phantom trips. Rethinking the assumptions behind trip generation studies may not only avoid wasting resources on over-sized roadways, but can also support efforts to promote transit-oriented, livable communities.
This article is adapted from “Phantom Trips: Overestimating the Traffic Impacts of New Development,” originally published in the Journal of Transport and Land Use.
Further Readings
Adam Millard-Ball. 2014. “Phantom Trips: Overestimating the Traffic Impacts of New Development,” Journal of Transport and Land Use, Forthcoming.
Adam Millard-Ball and Patrick Siegman. 2006. “Playing the Numbers Game,” Planning, May: 18-21.