ACCESS 18, Spring 2001

Editorial: Sustainability

Melvin M. Webber

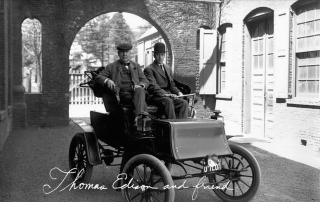
Despite ever-growing impatience with traffic congestion and persisting complaints about air pollution, the auto-highway system has proved to be remarkably adaptable and sustainable. Even though average annual miles per vehicle have recently declined, cars still consume a lot of energy, exude a lot of noxious gases, and kill far too many people. The immediate causes of congestion and pollution are an increase in the sheer number of cars and trucks. Yet, even in the current economic decline, sales continue to rise.

Download the PDF.

2017-05-30T23:07:29+00:00Categories: ACCESS 18, Spring 2001|

R&D Partnership for the Next Cars

Daniel Sperling

In September 1993 President Bill Clinton and chief executive officers of Ford, Chrysler, and General Motors created the Partnership for a New Generation of Vehicles (PNGV). Their primary goal was to develop a vehicle with up to three times the fuel economy of midsize 1993 US cars (about eighty mpg) with no sacrifice in performance, size, cost, emissions, or safety. Billions of dollars were to be spent over ten years, split roughly fifty-fifty between government and industry. They planned to select the most promising technologies by 1997, to build a concept prototype by 2000, and to have a production prototype by 2004. The program has adhered to that schedule.

Download the PDF.

2017-05-30T23:07:40+00:00Categories: ACCESS 18, Spring 2001|Tags: |

How Federal Subsidies Shape Local Transit Choices

Jianling Li and Martin Wachs

Suppose you're going to buy a new car that you’ll keep for ten years, and you've reduced the choices to two. The first has a price tag of $20,000 and an annual operating expense of $1,500, while the second costs $15,000 with annual operating costs of $1,800. If you were making an economically rational decision—all else being equal—the second car would be your least total-cost choice, since your total ten-year cost for the first would be $35,000 and for the second, $33,000. But if your rich uncle came along and offered to pay half of the initial purchase, your economically rational choice would change to the first one. Now your net cost for ten years would be $25,000 for the first and $25,500 for the second.

Download the PDF.

2017-05-30T23:07:57+00:00Categories: ACCESS 18, Spring 2001|Tags: |

Informal Transit: Learning from the Developing World

Robert Cervero

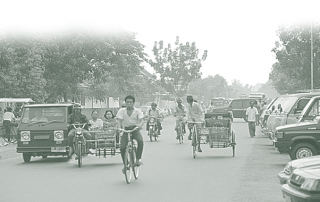
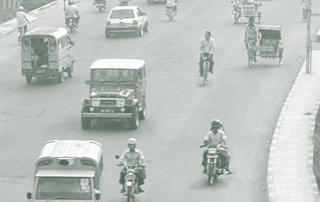
Consumer choice is the American way. We have come to expect variety, for example, in our supermarkets. Twenty-five years ago salad lovers were largely stuck with iceberg lettuce; today, however, we find a wide choice of butterhead, romaine, and ruby-leaf lettuces in the vegetable section. Salad consumption is up, and perhaps we’re a little healthier for it. Why do we not enjoy comparable variety and choice in our urban transit sectors? Transit systems can be remarkably versatile. Left to their own devices, they respond and adapt to emerging markets and technologies. In an open and competitive setting, transit operators are keenly aware of the slightest changes in market conditions and accommodate to them. Quick to adjust and eager to make a profit, they deliver what travelers want—a wealth of service options, ranging from motorized three-wheelers to van-size carriers to minibuses, priced at levels the market will bear.

Download the PDF.

2017-05-30T23:08:15+00:00Categories: ACCESS 18, Spring 2001|Tags: |

The Value of Value Pricing

Kenneth A. Small

Seeking ways to ease highway financing and alleviate traffic congestion, policy makers have put toll roads on the national agenda. The public is skeptical of the idea, to say the least. So the federal government has been sponsoring demonstration projects, both to gain practical experience and to increase public familiarity with road-pricing concepts and the ways they work. Although most of the demonstrations are merely studies, two are currently operating on real roads in California. They show that the hardware and software work well, that transactions and enforcement are manageable, and that drivers easily adjust to pricing. One project, the SR91 express lanes in Orange County, is a privately financed ten-mile roadway that parallels the Riverside Freeway (SR91), a notorious bottleneck. Drivers using the new roadway pay electronically according to a fee schedule that varies by time of day and day of week. Three-person carpools use the lanes at a discount. When the new lanes opened, typical peak-hour delays on the original lanes on this ten-mile section fell from over thirty minutes to less than ten minutes.

Download the PDF.

Why Bicyclists Hate Stop Signs

Joel Fajans and Melanie Curry

A bike commuter has a lot to consider before leaving for work. What route to take, considering hills and traffic? What clothes to wear, considering ease of movement, comfort, perspiration, distance, and weather? But these questions fade when compared to the safety, speed, and energy issues bicyclists deal with en route. Transportation planners know that incorporating bicycles into the transportation system can help ease traffic congestion by substituting bikes for cars; they also Why 1know that mixing cars and bikes can be tricky. But they seldom account for the bicyclist's concerns-matters that don't occur to the typical car-driving planner. Unless planners take bicyclists' concerns seriously, their efforts will do little to increase the numbers of bicycles or help bicyclists and drivers coexist safely.

Download the PDF.

2017-05-31T21:26:01+00:00Categories: ACCESS 18, Spring 2001|Tags: |

THE ACCESS ALMANAC: Census Undercount

Paul Ong

The decennial census is America’s single most important effort to collect data on its population, and yet the count always comes up short. Over the years, the counts have been getting somewhat better, although it’s still nearly impossible to include everyone. Estimates of the uncounted population declined steadily from 5.4 percent in 1940 to 1.2 percent in 1980, then increased to 1.8 percent in 1990. Preliminary estimates for 2000 range from 0.96 to 1.4 percent. One troubling aspect of the undercount is the sizable variation among groups—what’s called the “differential undercount,” because groups are undercounted differently. Preliminary estimates for the 2000 census show undercount rates for minorities that are several times higher than rates for non-Hispanic whites—three times higher for African Americans, four times higher for Hispanics, and seven times higher for American Indians on reservations. Undercount rates also vary by region, level of urbanization, and home ownership.

Download the PDF.