The effectiveness of transportation policies will depend on how users respond to them. Therefore, we must understand how to predict and influence behavior over the long term, which is the realm of travel demand modeling.
Relevant decisions made by individuals include where to live and work; the type and quantity of vehicles and transit passes to own; the types, locations and scheduling of activities; and by what modes and routes one travels to those activities. This article explores ways to improve travel demand models to reflect actual behavior, whether it is “rational” or not.
The statistical models used for predicting transport-related behaviors are predominantly rooted in the microeconomic paradigm of rationality, which assumes that people can accurately calculate and compare the value of options and then follow the best possible course of action. But are people rational when it comes to making transportation decisions? Are you aware of all of your transportation alternatives? Do you understand and weigh travel times, monetary costs and reliability by mode? Do you choose the alternative with the minimum generalized cost calculated solely from travel times and monetary costs? Or are there other factors that influence your decision such as comfort, convenience, habits, values, or peer influences?
Behavioral science researchers have a long history of raising serious questions about the rationality assumption. Their research has often succeeded in pointing out seemingly inconsistent and non-sensible choices. For example, an experiment in the 1970s conducted by behavioral economists Daniel Kahneman and Amos Tversky found that, while most people would travel an extra 15 minutes to save $7 on a new pen, most people would not travel an extra 15 minutes to save $7 on a new suit. An assumption of rationality would suggest that $7 should equal $7 regardless of context. While this behavior is perhaps irrational by some definitions, it is bias in a predictable and measureable direction if what matters is the magnitude of the savings relative to the cost of the item.
 Instead of assuming that people make mistakes when they act outside of what a narrowly defined theory of rationality would predict, behavioral modeling incorporates intricacies of the decision-making process, such as hidden but systematic rules that govern behavior. If these are not accounted for, it may appear that people are making irrational transport choices.
Early transportation planners employed the behavioral assumption that people choose the alternative with the minimum generalized cost, with cost narrowly defined as a function of travel time, the value of that time, and monetary costs. When it was realized that such a deterministic rule was often violated, probabilistic models of behavior became the dominant form. Such models introduce error terms to the preference equations, which is a first step in capturing so-called irrationalities.
Probabilistic techniques, such as logit and probit, are still the dominant form in travel demand modeling, and are becoming more behaviorally realistic. It is important to note that rationality is not a fundamental assumption in these models, as “irrational” processes (as long as they are predictable) can be incorporated.
In this article I emphasize three different themes based on research I conducted with my students. The first has to do with how people make trade-offs between time, money, and other factors such as environmental impacts. The second has to do with the roles that social influences play in travel and activity behavior. The third is focused on the heterogeneity of travel-related behavior. In all cases the methods underlying the findings discussed involve observing choices that people make (either in a hypothetical or realsetting). From these observations, we make inferences regarding the underlying preferences. The overriding objective is to develop travel demand models that better reflect actual behavior.
Trading off Time, Cost, and Environmental Factors
Decision making essentially involves trade-offs. Travelers weigh different levels of attributes—time, monetary cost, reliability, comfort, convenience, safety, and so forth—across travel alternatives. A single alternative rarely fares best in each of these dimensions, and therefore a traveler has to weigh the importance and relative value of each attribute and choose the alternative that provides the greatest utility. The most important behavioral trade-off in transportation is between the time cost and monetary cost. One’s value of time is expected to be on the order of one’s wage rate and it represents the amount of money that one is willing to spend to save a certain amount of time. This impacts whether one chooses a relatively fast yet expensive alternative (such as a car) or a relatively slower yet cheaper alternative (such as a bus).
While time and cost are critical, travel modes have other important attributes. Reliability of travel time has been emphasized in the literature. Comfort and convenience have also been studied. However, the typical transport model is still fairly sparse in terms of representing the attributes of alternatives.
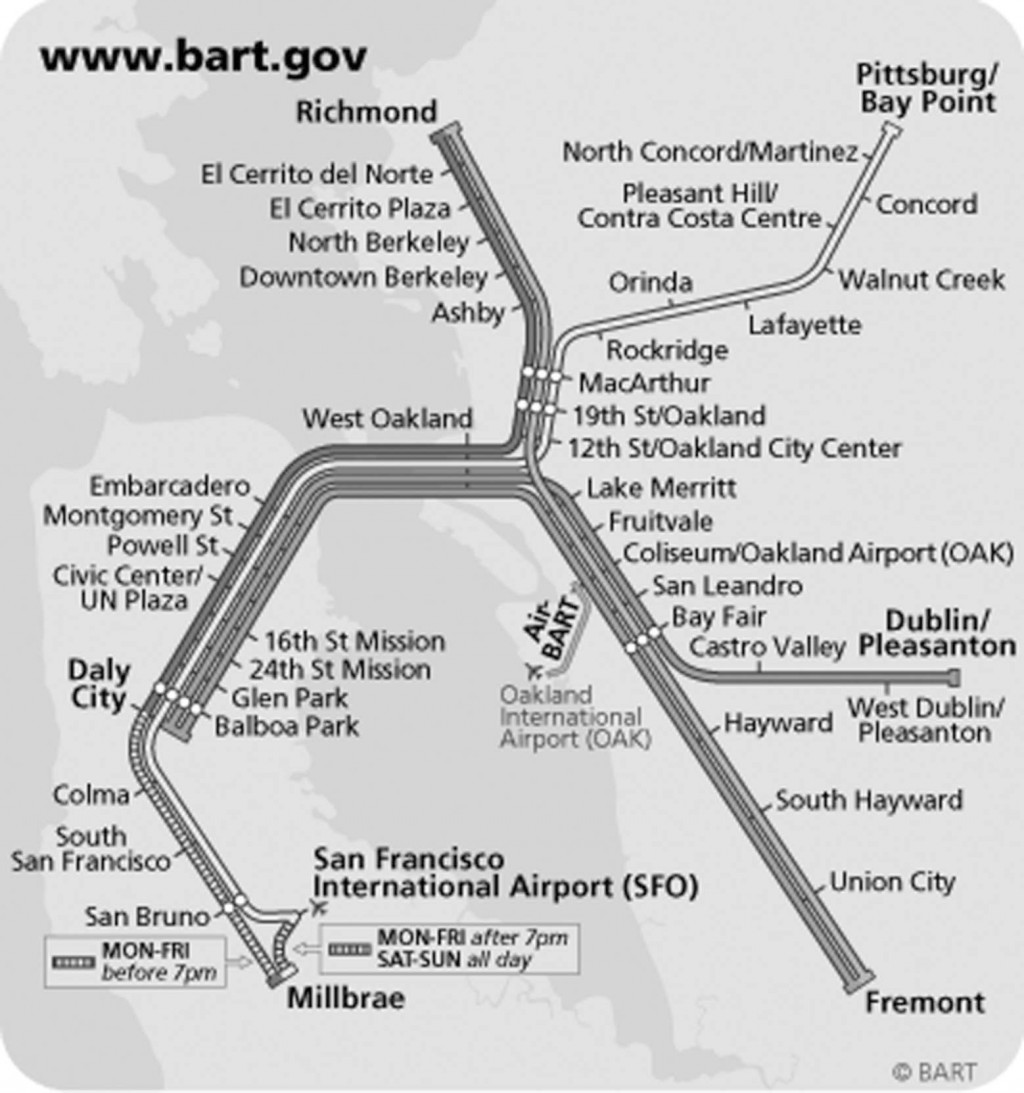
 One attribute that has been appearing more frequently on transportation websites is the environmental impact of travel decisions. For example, Figure 1 shows a screen capture from the Bay Area Rapid Transit’s website that reports a savings of 23 pounds of CO2 if one takes BART instead of driving from Berkeley to the San Francisco airport. However, little seems to be known regarding what impact, if any, such information has on transport decisions.
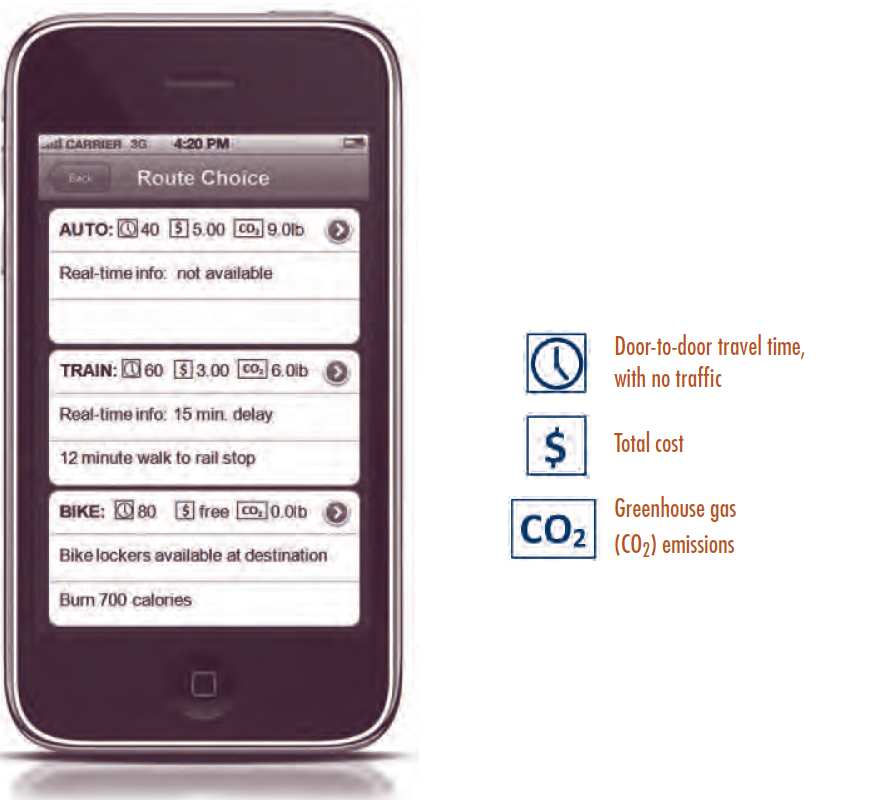
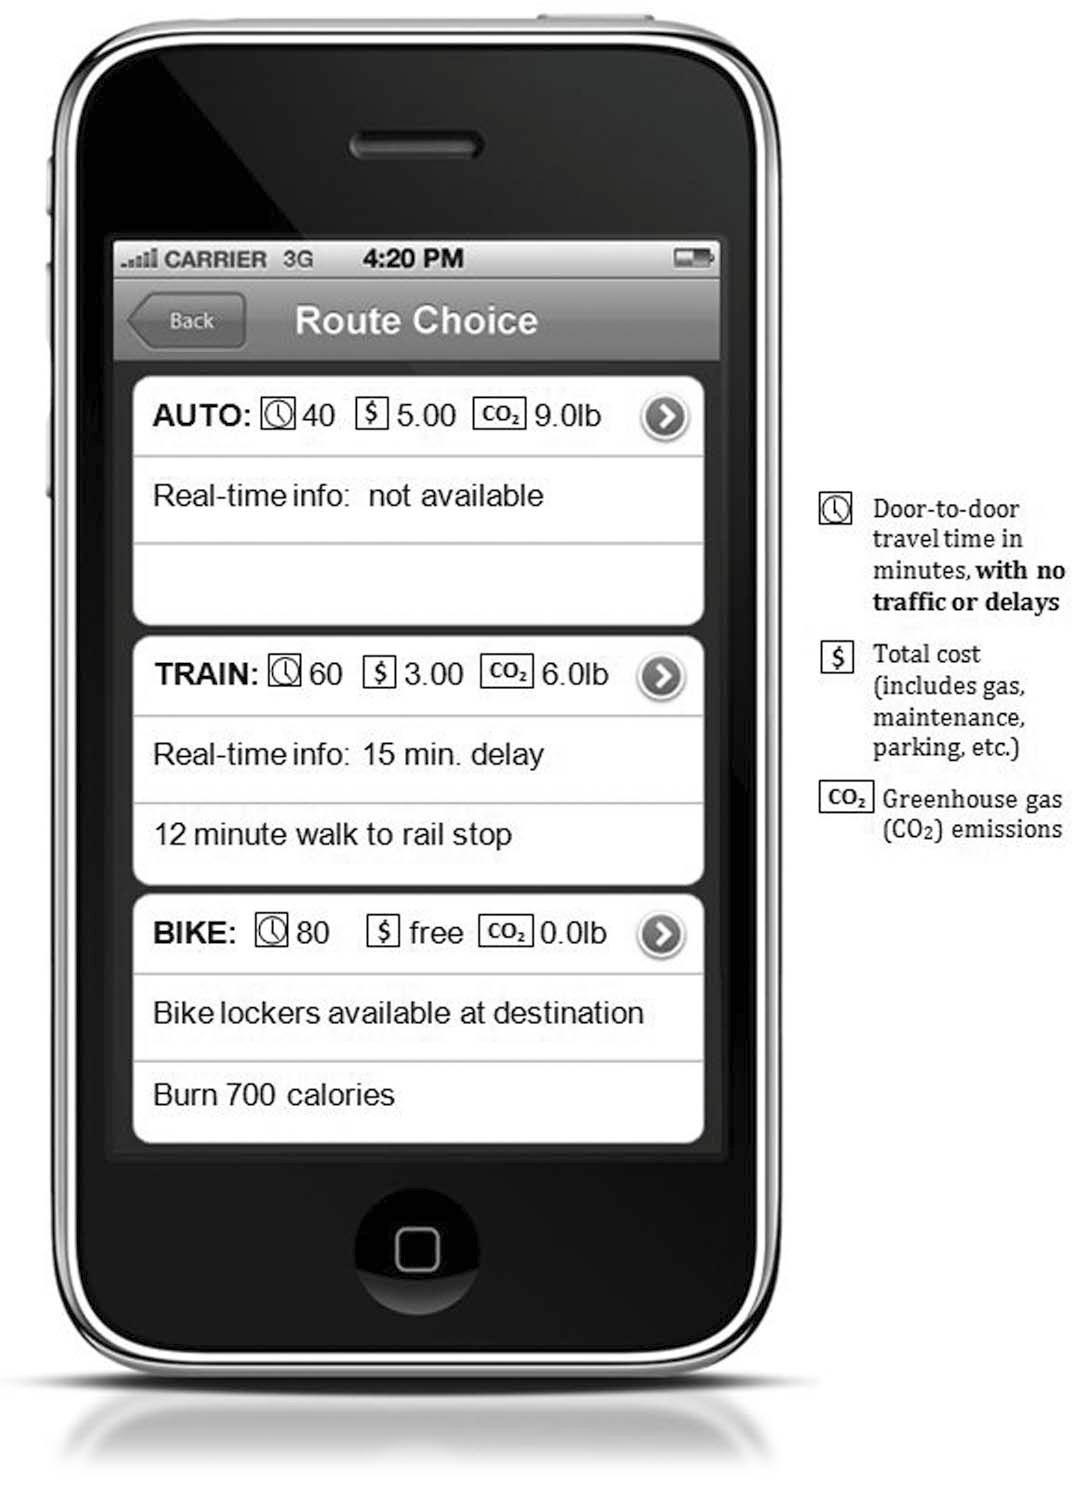
To study the potential impact of providing environmental information to system users, we designed a behavioral choice experiment and used UC Berkeley undergraduates as subjects. We presented them with hypothetical scenarios and offered them auto ownership, mode choice, and route choice decisions. The decisions all involved making trade-offs between attributes such as travel time, monetary cost, reliability, safety, and greenhouse gas emissions. An example screen from the mode choice experiment is shown in Figure 2, where we used a mock-up of an iPhone traveler information app to display information to students about possible travel choices. Given the particular context of the trip (such as a commute trip) and the travel information provided on the phone, subjects were asked which mode they would choose. Different subjects were provided different alternatives and values of the attributes. The auto ownership and route choice experiments had a similar design.
We found that our subjects were willing to reduce emissions at the cost of time and/or money. They exhibited an average willingness to pay for emissions reduction, or what we call the value of green, of 15 cents per pound ($300 per ton) of CO2 saved. This estimate was consistent across choice context (such as whether the CO2 savings were achieved through vehicle choice, mode choice, or route choice) and presentation (for example, whether the information was presented in tons or pounds). We also found significant heterogeneity in the value of green, with most values ranging between 0 and 70 cents per pound of CO2 saved.
These results are influenced by the particular demographic of our sample, UC Berkeley undergraduates. Relative to the population at large, our subject group is highly educated, young, idealistic, and part of a community that is regularly recognized as being a national leader on environmental issues. It is also influenced by the fact that these are decisions made in the lab rather than a real market. The significance of our results lies not in the estimate of $0.15/pound, but rather in the consistency of the estimated average value of green for this particular population across choice tasks. The results indicate that our subjects can evaluate the rather abstract notion of pounds of C02 and exhibit intentions to modify their behavior as a result. This suggests the importance of attitudes and value systems in making transport choices that go beyond issues of time and monetary cost.
Social Influences
Social influences are another source of perceived irrationality. Psychologists and behavioral economists emphasize that we are social beings who are influenced by those around us. However, the statistical framework used to model travel demand is conventionally grounded in individual choice, assuming that choices are made independent of others’ decisions.
But when we explored the role of social influences in transport behavior, we typically found them to be important. For example, in the experiments described above we also tested for the strength of social influences on transportation choices. Subjects in the auto ownership experiment were provided with a home and a work context and the commute times by mode. We then asked them whether they would purchase a conventional car (described as having a specific purchase price, annual cost, and annual greenhouse gas emissions), purchase a hybrid car (with the same set of attributes), or choose not to own a car. We also told some subjects in the experiment what their peers in the lab had chosen. We found that the peer information significantly swayed their choices. Subjects were more likely to choose a hybrid car if we told them that a large portion of their peers chose a hybrid car.
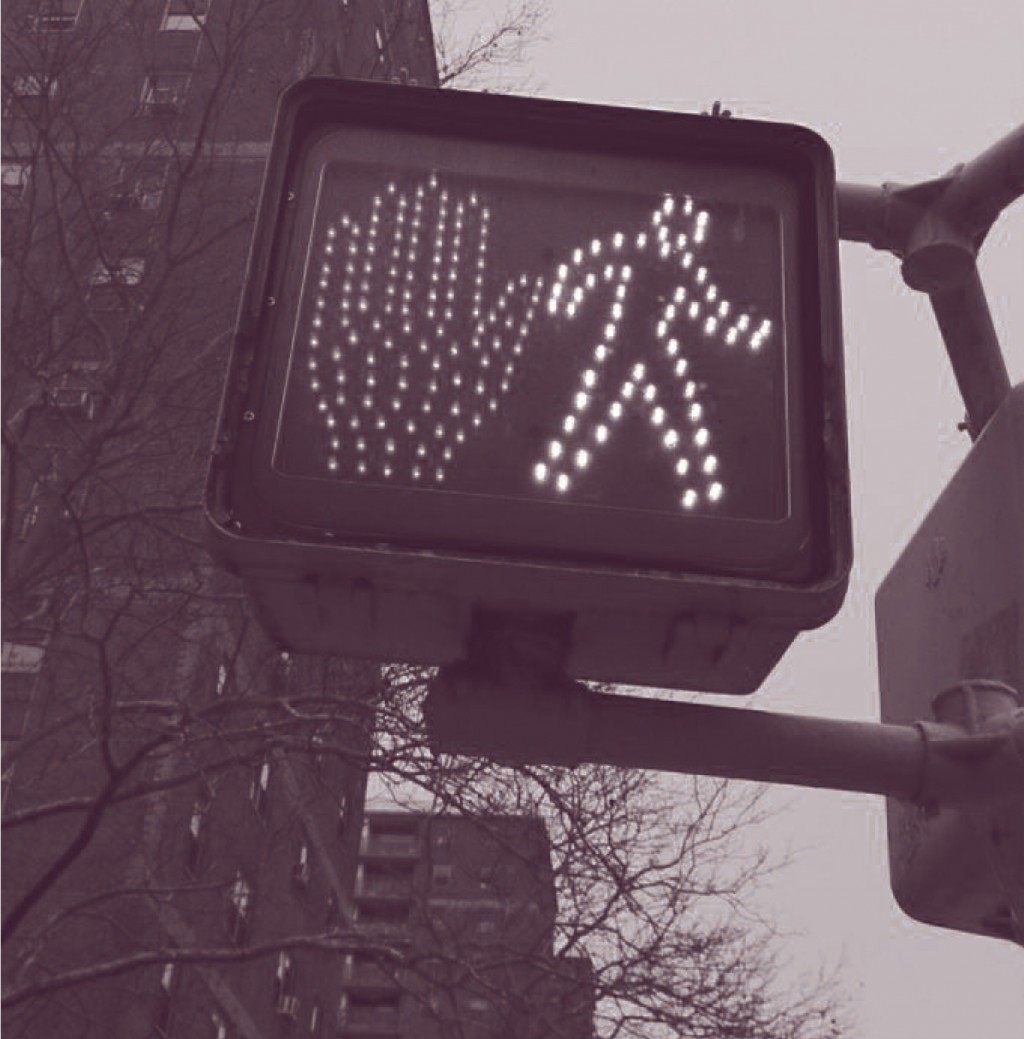
In the same experiment, we also explored pedestrian safety behavior, namely how different pieces of information influence obedience at traffic signals. We included different types of information aimed at influencing pedestrian jaywalking behavior, including information based on the law, on accident and citation rates, and on the behavior of peers. We then presented subjects with only one of these pieces of information, and asked whether they felt that in the coming week they would cross against red lights more frequently, less frequently, or the same as the previous week. We found that information on the law, citation rates, and accident statistics had no effect. The only piece of information that had a significant effect was the information on peer compliance with pedestrian laws. Unfortunately, telling students that others at Berkeley walk against the traffic signal 28 percent of the time (a statistic based on an informal survey at local intersections) led them to report that they were more likely to cross against red lights in the coming week.
We have done other work to incorporate theories of social network effects into travel demand modeling. Using a household travel diary from the Netherlands, we developed a mode choice model that incorporates social influences from peers. We defined peers to be those in the decision maker’s residential neighborhood and socio-economic strata. Then we included as explanatory variables the mode shares of these peer groups. We found these factors to be significant. Modes that were used by one’s social reference groups had an extra level of attractiveness beyond what would be suggested by travel times and travel costs. Note that this effect remains after employing instrumental variables to control for self-selection, similarities in tastes within socio-economic groups, and similarities in transport service within neighborhoods.
These social influences have important implications in transport behavior because they suggest a feedback loop between decision makers that can be self-reinforcing over time. This is often referred to as a social-multiplier effect, a bandwagon effect, or herd behavior. For example, with the introduction of a new transportation mode, such as bikesharing or carsharing, a feedback effect between members of a social group can propel the adoption of the new mode over time. The reinforcement may be either in a desirable direction (toward more sustainable or safer behavior) or, as illustrated by the pedestrian case, in an undesirable direction. The many new forms of social networking make this role of reinforcement even more important.
Attitudes and Value Systems
 Another important source of perceived irrationality is the fact that individual preferences vary widely in terms of attitudes towards modes (for example, car lovers versus car haters) and urban environments (for example, suburban lovers versus urban lovers). Such deep-rooted orientations lead to differences in preferences for travel and location. While the concept of heterogeneity is well established in travel behavior research, typically such segmentation is inferred based on socio-economic classifications, observed behaviors, or responses to attitudinal surveys.
We have been studying the issue of segmentation using modeling techniques in which the segmentation is determined by the underlying preferences that affect the behavior. The idea is that there are distinct segments (or classes) in the population and each class exhibits distinctly different preferences or, in other words, each class has a different model specification. The modeling method results in an estimate of the number of distinct segments, the preferences of each segment (the choice model), and the socio-demographics that tend to be associated with each segment.
There are distinct segments (or classes) in the population and each class exhibits distinctly different preferences or, in other words, each class has a different model specification.
We studied residential housing choices using a stated preference survey conducted by Portland Metro. Subjects selected from a set of hypothetical housing options, each described by attributes of the price, the structure, the lot, the neighborhood, and accessibility to stores and to one’s work. We found three groups of people, each with distinctly different housing environment preferences. One group consisted of those drawn to suburban living, with a preference for larger lots and houses, auto use, and good schools. These tended to be more affluent families with older children. Another group was the opposite: its orientation was toward urban settings with higher density and more urban activity. Members of this group tended to be professionals and households without children. The third group was primarily focused on transit accessibility, but also on good schools and less dense environments. Members of this group tended to be less-affluent, younger families. The models we used not only provide information on the different segments (or classes) of behavior, but also the size of each segment. In the case of the Portland sample, the division was 43 percent suburban oriented, 27 percent urban oriented, and 30 percent transit oriented. These results suggest that people have strong modal preferences.
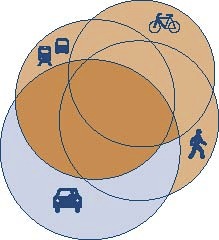
To study this issue further, we used a six-week household travel and activity diary from Germany (MobiDRIVE). The duration of this survey allows us to observe modal patterns and preferences that are difficult to detect in a typical one- to two-day survey. The model results indicate three groups distinguishable by their modal preferences. These are depicted in Figure 3. We use a Venn diagram to demonstrate where individuals fall in terms of orientation toward different modes. Each circle corresponds to one of four main modes: auto, transit, bike, and walk. The first group consists of people strongly oriented toward the auto. These individuals tend to walk when they don’t drive. The second group appears on the opposite side and consists of “green” travelers who prefer not to drive. The third group consists of travelers who have more balanced preferences that include the auto along with transit and/or biking. Note that membership in these groups is based on preferences, after controlling for the modal alternatives available for any given trip. The division of the sample was 34 percent auto oriented, 26 percent green, and 40 percent multimodal. These splits are based on the German context we analyzed and would likely be different in the US.
In both the residential choice analysis and the mode choice analysis, the models that explicitly allow for distinct market segments provide a better fit to the data than other approaches for capturing heterogeneity. More importantly, the behavioral underpinning of unobserved heterogeneity provides a richer and more robust framework for tailoring different policies to different groups. Further, the structure of the model helps explain behaviors that may appear irrational, such as why people drive even when there are alternatives that appear more attractive.
Conclusion
It is essential to anticipate the actions of users in order to effectively design and manage transportation systems and to analyze the potential of policies designed to change behavior.
Predicting behavior is critical for transport policy making, system design, and operations. It is essential to anticipate the actions of users in order to effectively design and manage transportation systems and to analyze the potential of policies designed to change behavior. Predicting behavior is challenging—humans have varying preferences, motivations, experiences, and decision-making processes. Indeed, forecasting demand has proven elusive, with a long history of poor predictions. However, ignoring the demand side due to its complexity is not the answer. We must enrich our models by incorporating important explanatory variables such as environmental factors, social influences, and heterogeneous attitudes and values. If such factors are not taken into account, it will appear that people are making irrational transport choices and modeling will fail to guide public policy to the best possible outcomes.
Further Readings
Elenna R. Dugundji, Antonio Paez, Theo A. Arentze, and Joan L. Walker. 2011. “Transportation and Social Interactions,” Transportation Research Part A, 45 (4): 239–247.
David Gaker, David Vautin, Akshay Vij, and Joan L. Walker. 2011. “The Power and Value of Green in Promoting SustainableTransport Behavior,” Environmental Research Letters, 6 (3).
David Gaker, Yanding Zheng, and Joan Walker. 2010. “Experimental Economics in Transportation: Focus on Social Influences and Provision of Information,” Transportation Research Record: Journal of the Transportation Research Board, 2156: 47–55.
Daniel McFadden. 1999. “Rationality for Economists?” Journal of Risk and Uncertainty, 19 (1–3): 73–105.
Akshay Vij, Andre Carrel, and Joan L. Walker. 2011. “Latent Modal Preferences: Behavioral Mixture Models with Longitudinal Data,” Leeds, UK: International Choice Modeling Conference.
Joan L. Walker and Jieping Li. 2007. “Latent Lifestyle Preferences and Household Location Decisions,” Journal of Geographical Systems, 9 (1): 77–101.